


 05.10.2026 05:34 AM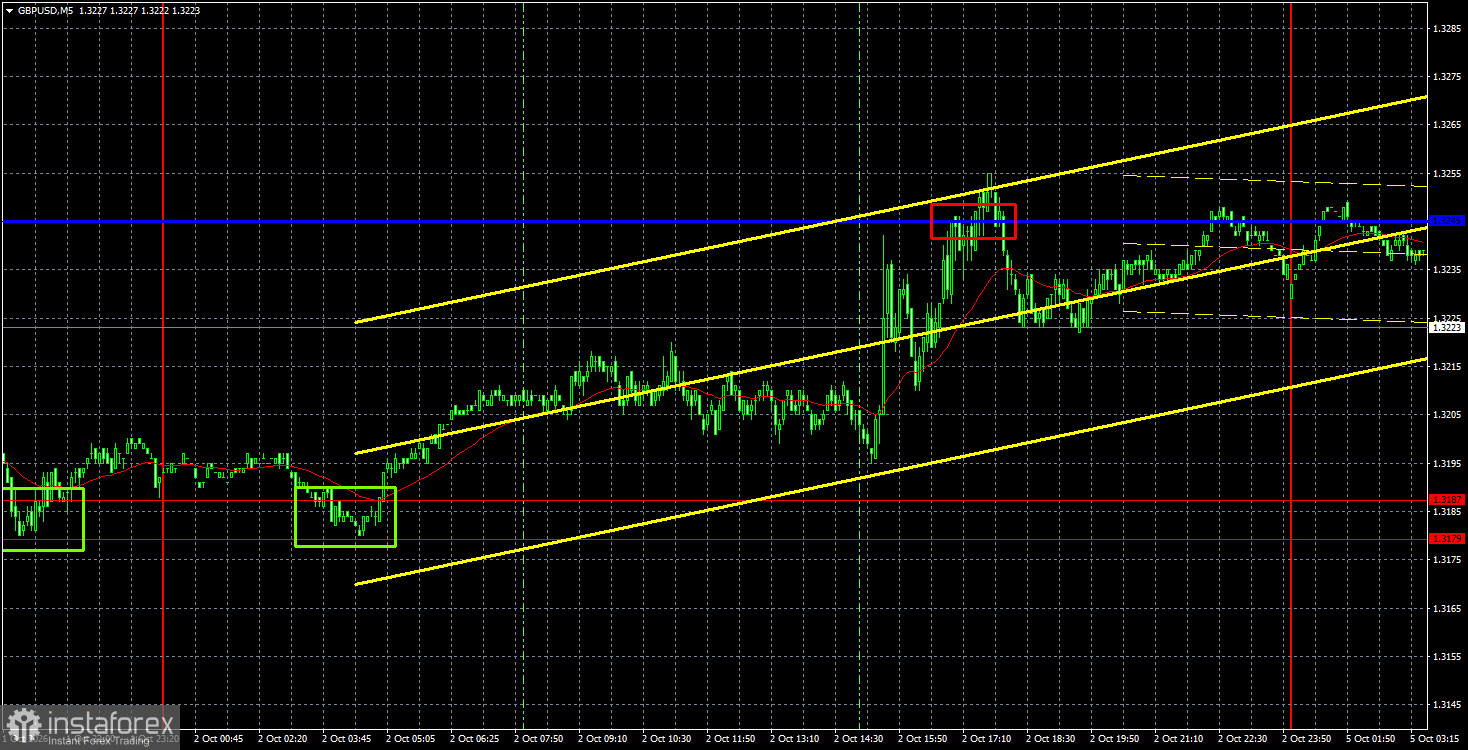
The GBP/USD currency pair posted modest gains on Friday after a month-long decline. Nevertheless, the pound at least rose slightly, unlike the euro. However, Monday began with a new decline as Yemen started an open war against the Houthis, who control a significant part of the country, including its de facto capital. Naturally, the market grew nervous again, since a new theater of military operations is unfolding near the world's second-most important strait — the Bab el-Mandeb. Thus there is a fairly high probability this strait may be closed soon as well, and then two key arteries for Middle Eastern oil would be blocked. In that case, oil prices could rise to $150–$200 per barrel, and investors would again flee to safety — or perhaps they already have, given the overnight dollar rise. It seems a third "black swan" has arrived in 2026, again providing powerful support for the US dollar—the dollar, which has been rising for a month on any pretext.
Technically, the British pound continues to form a downward trend, as shown by the trendline and the price trading below the Ichimoku indicator lines. Under current circumstances, the pound can at most expect a correction within the downtrend. If a second full-scale war in the Middle East begins now, the pound could continue to fall.
On the 5-minute TF on Friday, two strong trading signals formed that could have yielded excellent profits. During the Asian session, price bounced from the 1.3179–1.3187 support area, triggering a rise to the critical line. Long positions could have yielded traders about 40–45 pips. A rebound from the Kijun-sen line allowed opening short positions, and by Monday morning, the price had nearly returned to the 1.3179–1.3187 area, allowing another 40–45 pips of profit.
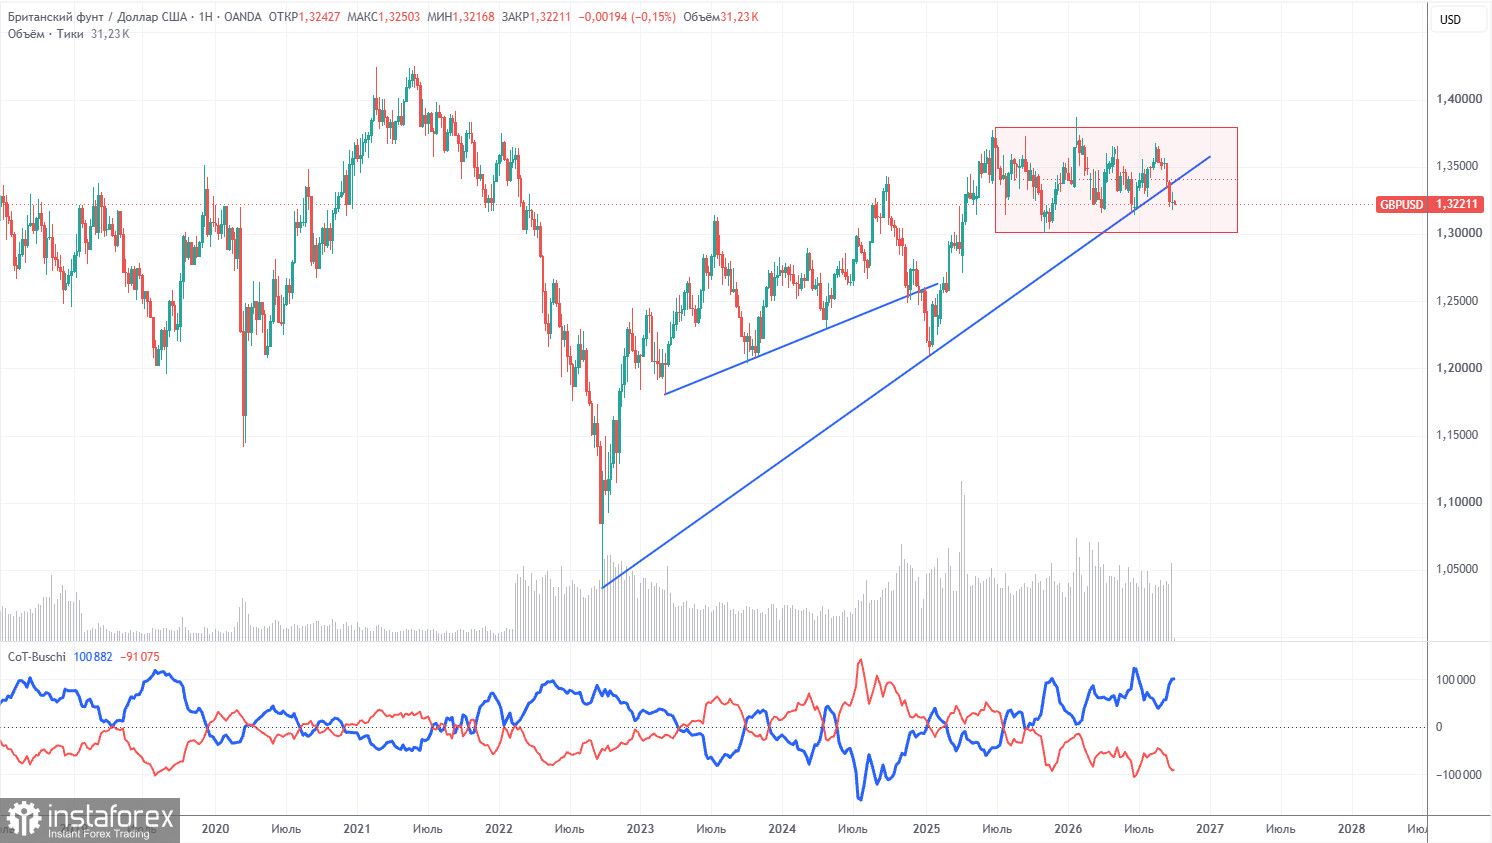
COT reports for the pound show that non-commercial traders have dominated the market with selling for several months. The net position is negative despite the long-term uptrend remaining intact. Given events in the Middle East, it is unsurprising that dollar demand remains high in 2026. The war between the US and Iran formally ended, but a new war inside Yemen has begun. The Federal Reserve's changed stance on monetary policy also supported the dollar, and the uptrend line was breached. However, it was breached under flat conditions, so we do not believe the uptrend is over.
In the long term, the dollar continues to decline due to Donald Trump's policies, which is clearly visible on the weekly TF. The trade war will continue in one form or another for a long time, and Trump's policy is aimed directly and indirectly at weakening the US currency. The long-term uptrend remains. According to the latest COT report (dated September 29), the "Non-commercial" group closed 13,100 BUY contracts and 4,500 SELL contracts. Thus, the non-commercial traders' net position decreased by 8,600 contracts over the week.
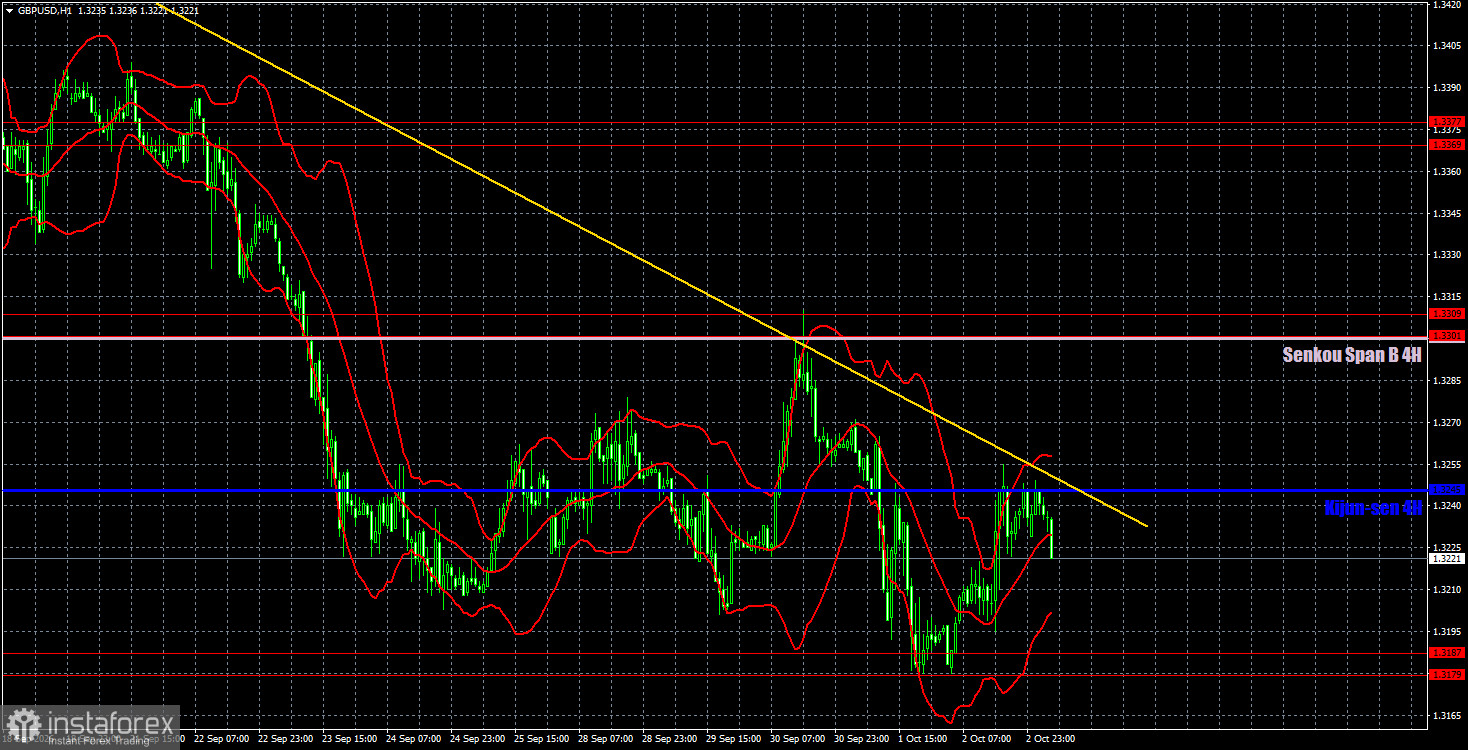
On the hourly timeframe, the GBP/USD pair continues to form a downward trend. The Fed's decision and stance have greatly changed the prospects for the US dollar and the market's attitude toward it. We would say that for the second time this year, a "black swan" has arrived in the market, bringing excellent news for the dollar when no one expected it. Now a third "black swan" may arrive and again trigger a powerful dollar rally.
For October 5 we highlight the following important levels: 1.3042–1.3050, 1.3096–1.3115, 1.3179–1.3187, 1.3301–1.3309, 1.3369–1.3377, 1.3465–1.3480, 1.3588, 1.3671–1.3681. The Senkou Span B (1.3301) and Kijun-sen (1.3245) lines can also be sources of signals. It is recommended to move the Stop Loss to breakeven when the price has moved 20 pips in the correct direction. The Ichimoku indicator lines may shift during the day, which you should take into account when determining trading signals.
No important publications or events are scheduled today in the UK, while the US will publish the important ISM services activity index. A reaction to this index may follow, but the market has already begun active dollar buying, so ISM is unlikely to change traders' sentiment.
Traders can consider the 1.3096–1.3115 area as a target for short positions if the price consolidates below 1.3179–1.3187. A rebound from 1.3179–1.3187 would make 1.3245 and 1.3301 targets for long positions.

