আরও দেখুন

 05.12.2023 03:34 PM
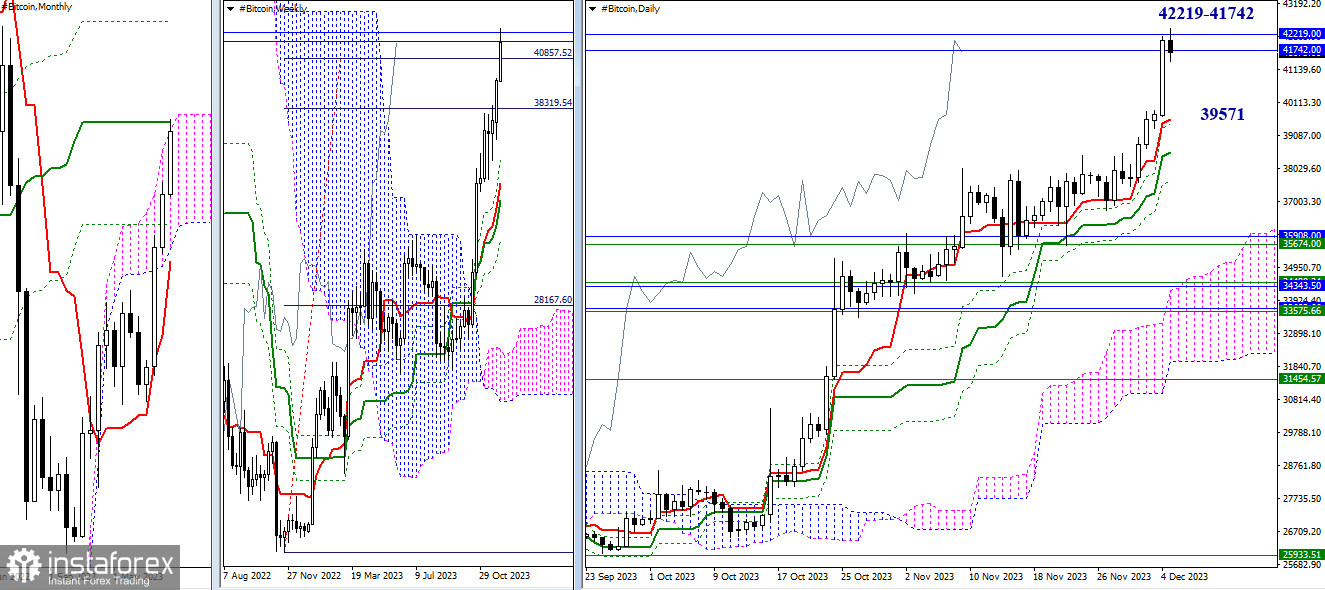
Higher timeframes
In November, Bitcoin slowly but steadily continued to rise. At the beginning of December, the upward momentum of market participants intensified. As a result, they not only achieved the weekly target of 40,857.52 (100% retracement) but also reached the confluence of monthly resistances at 42,219 – 41,742 (medium-term trend + upper boundary of the cloud). Breaking through these resistances and securely establishing in the bullish zone relative to the monthly cloud will significantly expand the upside potential for market participants. The next upward target will be the final level of the death cross of the monthly Ichimoku cloud (48,530), and in addition, a breakout target above the monthly cloud will be formed.
Failure to overcome these crucial and strong resistances may lead to the formation of a rebound and the initiation of a corrective decline. The daily timeframe will be the first to respond to this, with correction targets being the supports of the golden cross of the daily Ichimoku cloud, currently located at 39,571 (Tenkan) and 38,548 (Kijun). Next, for the development of a downward correction, the supports of the weekly golden cross will be considered, the nearest of which are currently at 35,674 and 34,472, with reinforcement from monthly support levels at 35,908 and 34,371.
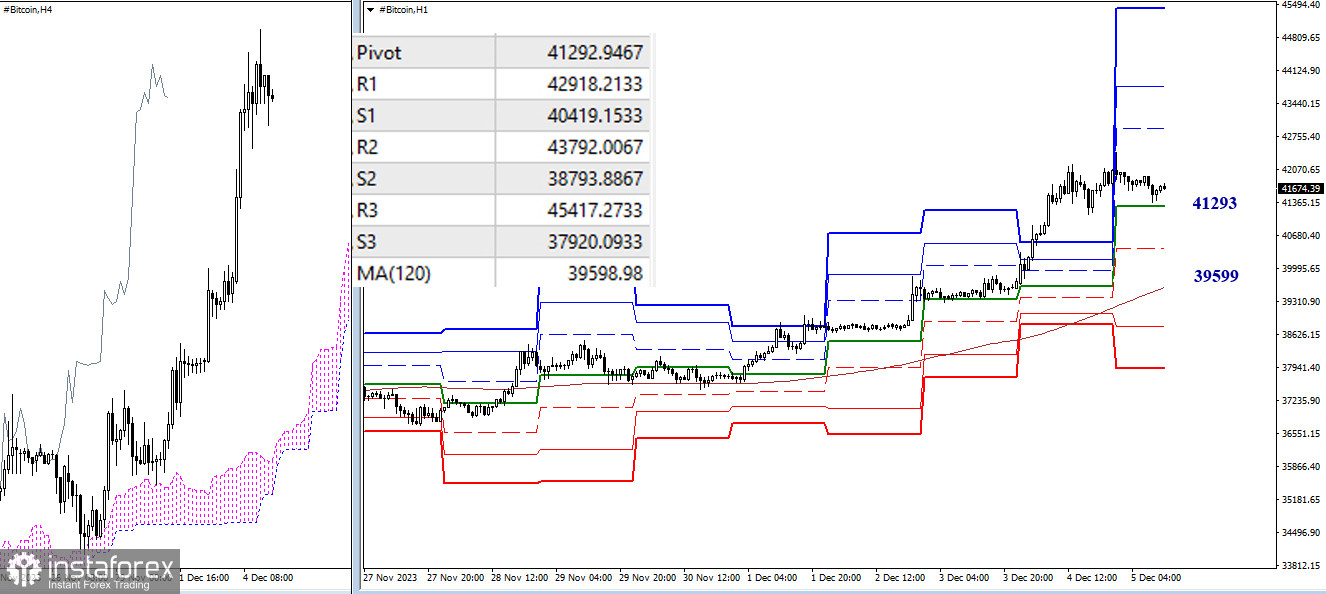
H4 – H1
Bulls now have the main advantage on the lower timeframes. However, the pair has been in a corrective zone for a long time. Exiting the zone (42,424) will refocus the market's attention on bullish targets. Intraday bullish targets are represented by the resistances of classic pivot points (42,918 – 43,792 – 45,417). If the corrective decline receives a new impetus, the first tasks for bearish market participants will be testing and breaking through key levels at 41,293 (central pivot point of the day) and 39,599 (weekly long-term trend), with additional support from S1 (40,419). If consolidation below and a reversal of the movement occur, it will allow bearish market participants to change the current balance of power and strengthen their positions, also creating new bearish prospects as a result.
***
The technical analysis of the situation uses:
Higher timeframes - Ichimoku Kinko Hyo (9.26.52) + Fibo Kijun levels
H1 - Pivot Points (classic) + Moving Average 120 (weekly long-term trend)
You have already liked this post today
*এখানে পোস্ট করা মার্কেট বিশ্লেষণ আপনার সচেতনতা বৃদ্ধির জন্য প্রদান করা হয়, ট্রেড করার নির্দেশনা প্রদানের জন্য প্রদান করা হয় না।


