আরও দেখুন

 03.11.2025 11:25 AM
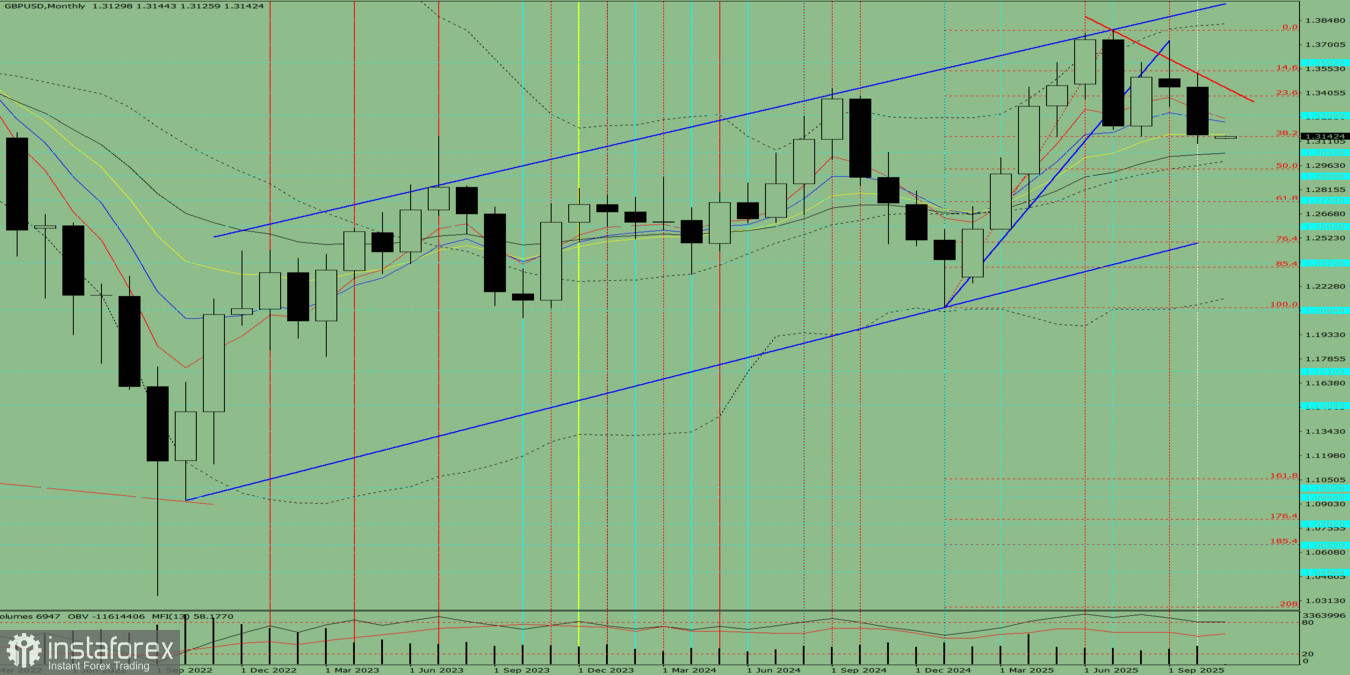
Fig. 1 (Monthly Chart).
Indicator Analysis:
Conclusion from comprehensive analysis: A downward trend is possible.
Overall summary of the monthly GBP/USD candle calculation:The price will most likely show a downward trend, with no upper shadow on the monthly black (bearish) candle (the first week of the month – bearish), and with the second lower shadow forming later (the last week of the month – bullish).
Alternative scenario:From the 1.3151 level (closing of the October monthly candle), the price may continue moving downward toward 1.2743 – the 61.8% retracement level (red dashed line). Upon testing this level, the price may rebound upward toward 1.2900 – the historical resistance level (light blue dashed line).
You have already liked this post today
*এখানে পোস্ট করা মার্কেট বিশ্লেষণ আপনার সচেতনতা বৃদ্ধির জন্য প্রদান করা হয়, ট্রেড করার নির্দেশনা প্রদানের জন্য প্রদান করা হয় না।


