আরও দেখুন

 04.02.2026 11:17 AM
Bitcoin and Ethereum have been hitting rock bottom in sync this week. The whole crypto market is falling in parallel. What caused Bitcoin to lose almost 40% — about $50,000 — in just four months?
First, two reminders for traders. No uptrend lasts forever. There are exceptions, but that rule is valid in most cases. We might be willing to believe gold could rise for a long time (though even this stunning rally will hardly last indefinitely), but Bitcoin is not gold and has no physical intrinsic value. Second, every Bitcoin bull cycle so far has ended with a 70–80% drawdown. From our viewpoint, the current action is therefore entirely natural.
Meanwhile, traders are wondering not only what's next for Bitcoin and the crypto market, but also what's in store for crypto companies like MicroStrategy that have invested in digital assets for years. Remarkably, MicroStrategy used not only its own capital to buy Bitcoin but also borrowed funds. While BTC rose and set records, the company's shares peaked as well. Now that Bitcoin is down about 40%, the shares are trading lower. Analysts estimate MicroStrategy's average BTC purchase price is around $76,000. Thus, after years of accumulation, the company led by Michael Saylor is now underwater.
Also worth noting, late last year many investors exited risky crypto and high-tech stocks, which greatly reduced crypto firms' ability to keep buying Bitcoin at any price. The picture looks like a house of cards or a financial pyramid: MicroStrategy borrows, buys BTC, this supports BTC prices and the company's stock. When Bitcoin falls, no new funds are available to prop up the price, shares drop and the structure collapses.
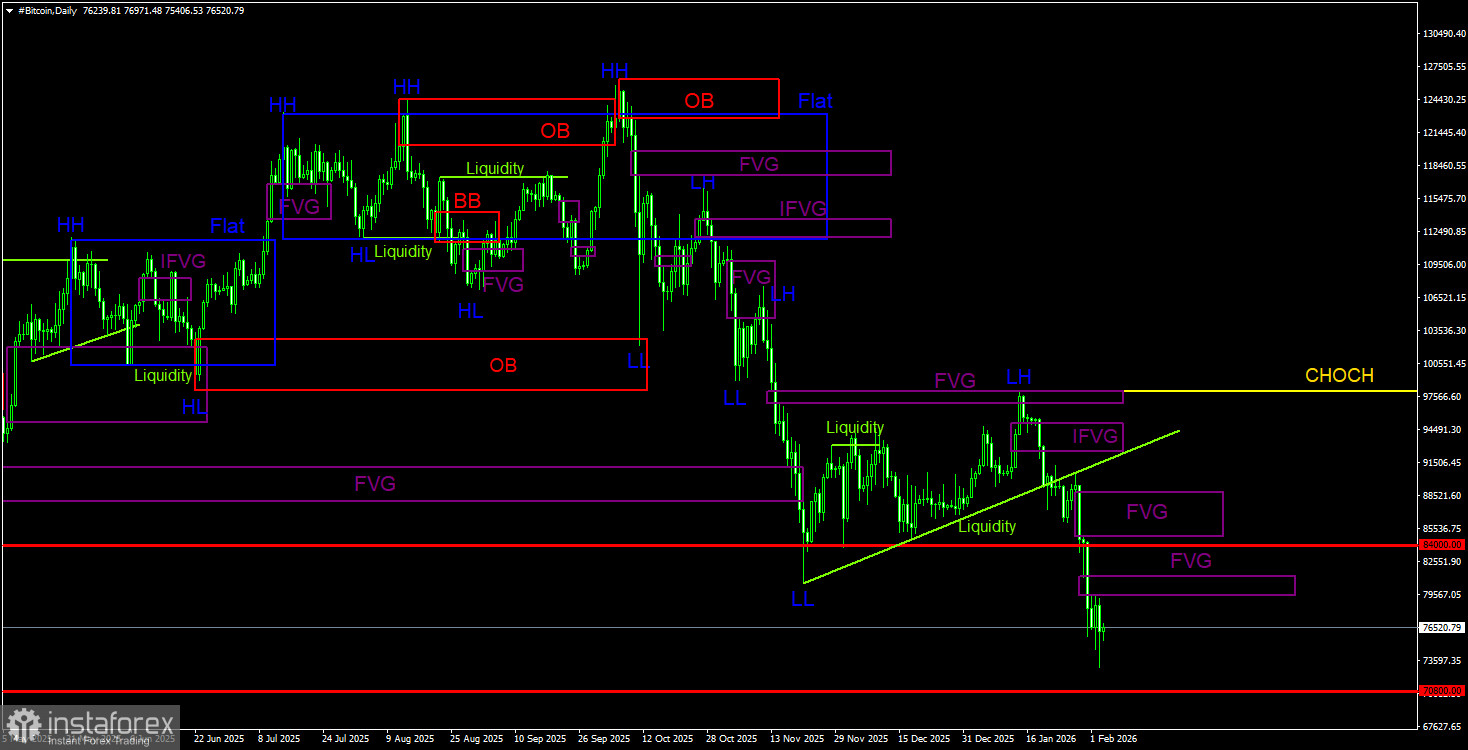
Bitcoin continues to form a full-fledged downtrend. We still anticipate a decline to $70,800 (the 50.0% Fibonacci retracement of the three?year uptrend), and there are no signs of a trend reversal or corrective rally. On the daily timeframe, POI sell areas include a bearish IFVG and two bearish FVGs. The 4?hour TF also shows three bearish FVGs that could provide opportunities to open new shorts. The nearest patterns are of primary interest.
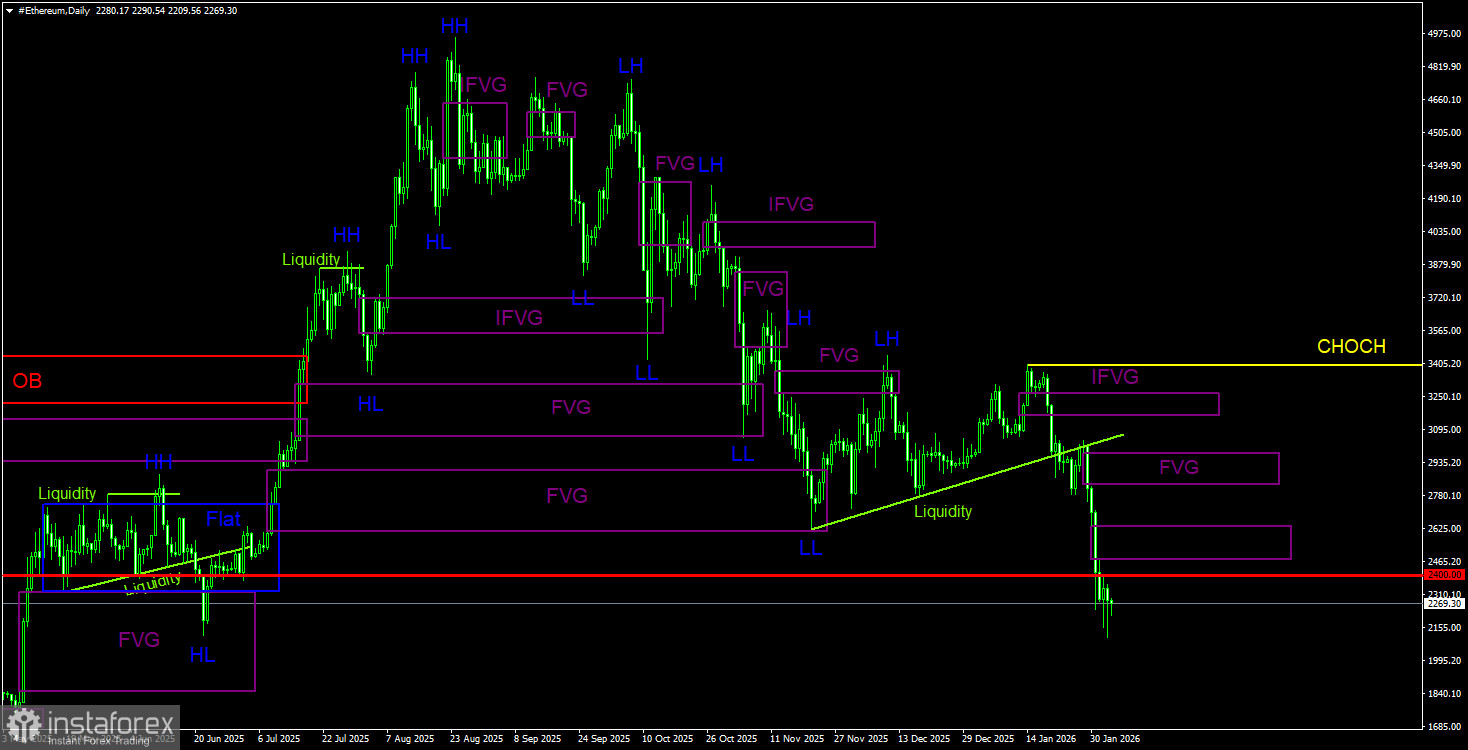
On the daily timeframe, a downtrend is still going on. The key sell pattern is the bearish order block on the weekly timeframe. The move triggered by that signal should be strong and prolonged. On the daily chart for Ethereum, there are three bearish FVGs; on the 4?hour chart there are two bearish FVGs. Traders may consider opening new short positions from those patterns. The most important patterns are the closest ones. Like Bitcoin, Ether shows no appetite to correct. Ether's downside targets extend down to $1,370, the start of the last uptrend.
CHOCH — change of character (break in trend structure). Liquidity — liquidity, traders' Stop?Losses that market?makers use to build their positions. FVG — Fair Value Gap: a zone of price inefficiency that price moves through very quickly, indicating absence of one side in the market; price later tends to return and react at such areas. IFVG — Inverted Fair Value Gap: after returning to this zone price does not get a reaction but breaks through impulsively and then tests it from the other side.
OB — Order Block: the candle where a market?maker opened a position to harvest liquidity and later establish a position in the opposite direction.


