আরও দেখুন

 17.03.2026 06:56 AM
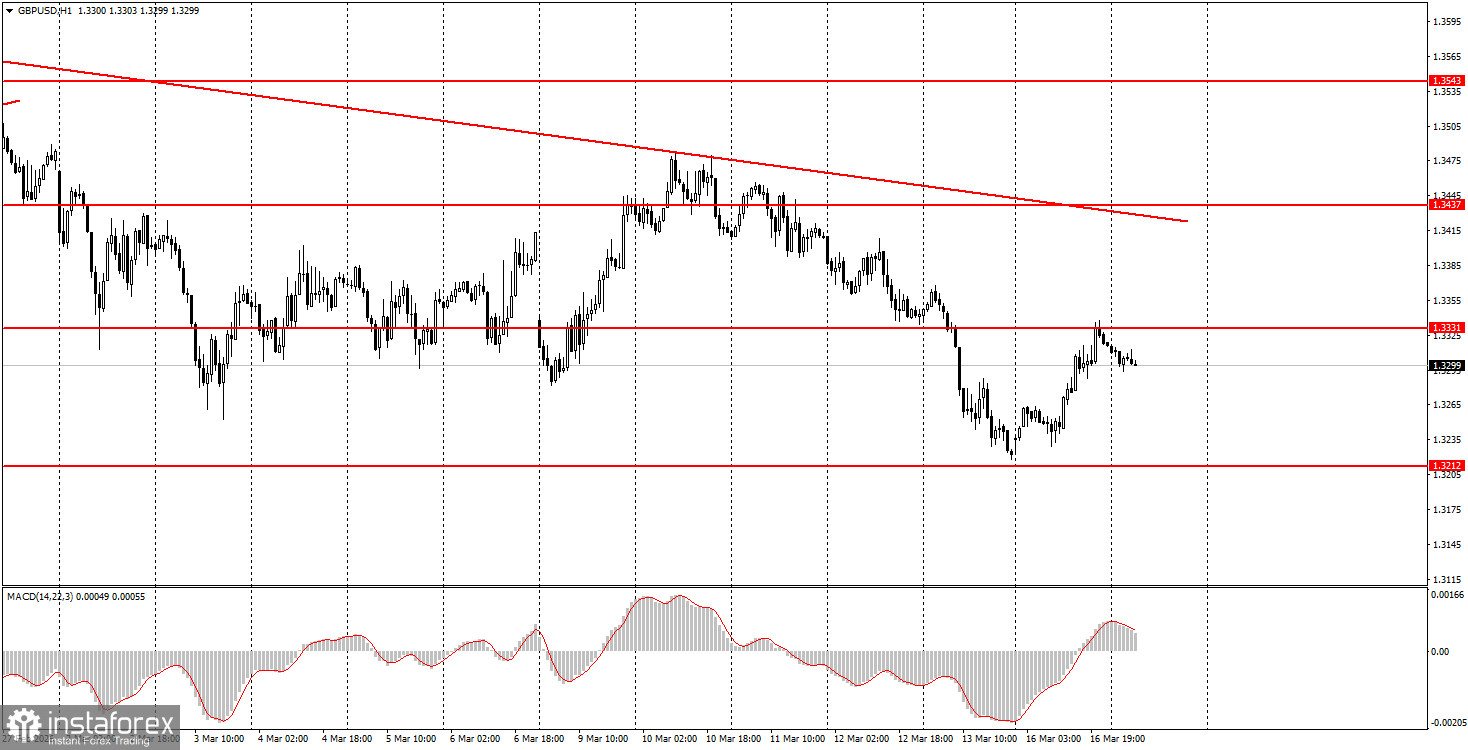
The GBP/USD pair posted a decent 100-pip correction on Monday. One would think that a 100-pip rise in the British currency, without visible local reasons or foundations, is wonderful! However, the preceding decline just last week was much stronger. Thus, a 100-pip correction under the current circumstances and geopolitical backdrop means nothing. The descending trend line remains relevant; the market could resume buying the US dollar at any time, and all factors adverse to the US dollar are simply being ignored. We acknowledge that the time has likely come when the market is no longer willing to massively buy dollars solely on the basis of the conflict in the Middle East. Yet, this hypothesis now requires serious technical confirmation. No one knows how much longer the market will chase risks into the dollar, how many more escalations will occur in the Middle East, and most importantly, what actions Donald Trump will take.
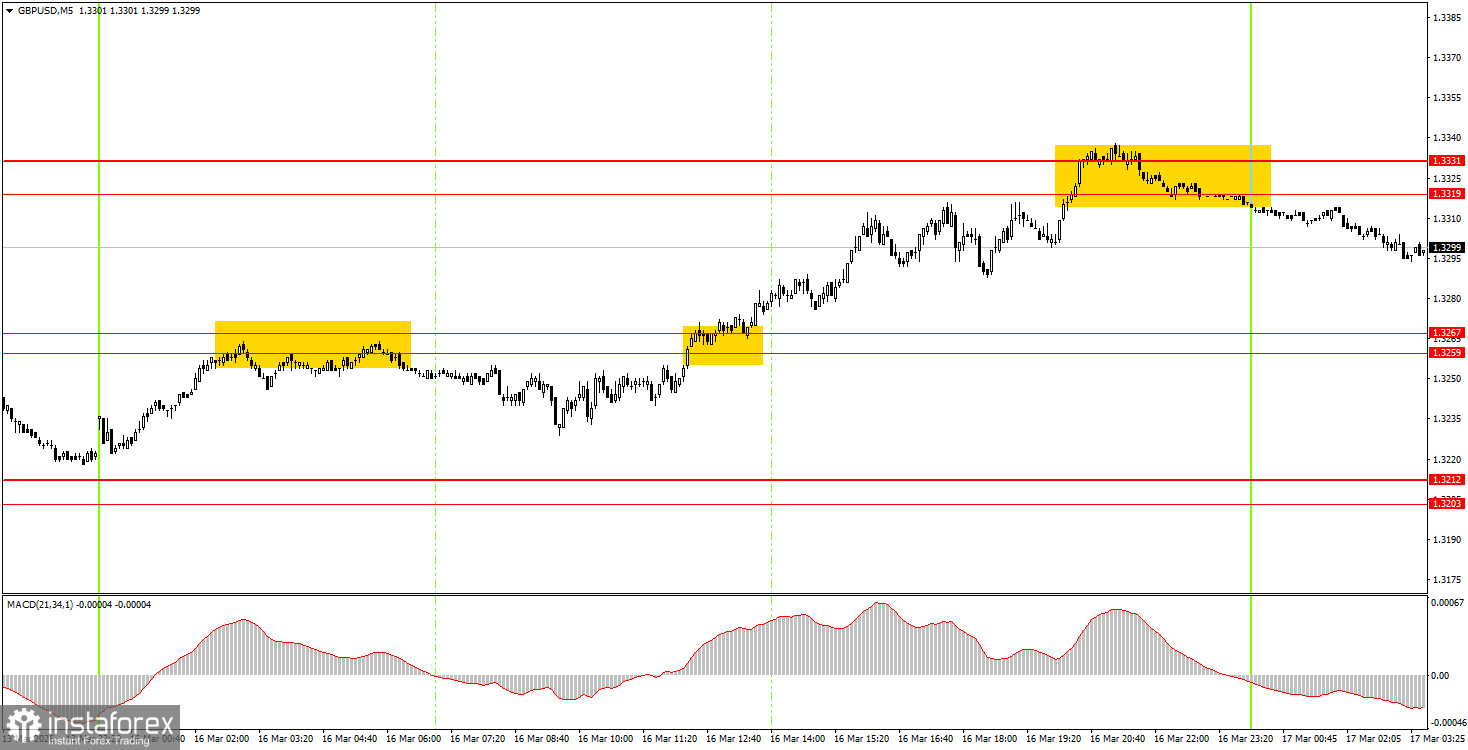
On the 5-minute timeframe, three trading signals were formed on Monday. At the start of the European trading session, the pair bounced from the area of 1.3259-1.3267, forming a sell signal, but the nearest target was not reached. Then, a buy signal followed in the same area with the nearest target of 1.3319-1.3331 being achieved. Towards the end of the day, a sell signal was also formed, which could likewise have been executed. Two out of three trades were profitable, with one breaking even.
On the hourly timeframe, the GBP/USD pair continues to form a "geopolitical trend." There are no global grounds for medium-term dollar growth, so we expect a resumption of the global upward trend of 2025, which could push the pair to 1.4000 at a minimum. However, in recent weeks, the market has been completely focused on the war in the Middle East, which has directly affected the value of the American currency.
On Tuesday, novice traders may consider opening short positions if there is a bounce from the 1.3319-1.3331 area, targeting 1.3259-1.3267. A price consolidation above the 1.3319-1.3331 area will allow for long positions with a target of 1.3403-1.3407.
On the 5-minute timeframe, current trading levels include 1.3096-1.3107, 1.3203-1.3212, 1.3259-1.3267, 1.3319-1.3331, 1.3403-1.3407, 1.3437-1.3446, 1.3484-1.3489, 1.3529-1.3543, 1.3643-1.3652, 1.3695, and 1.3741-1.3751. No important events or reports are scheduled in the UK on Tuesday, while the only release in the US will be the weekly ADP report, which holds little value for traders.
Price levels of support and resistance are levels that serve as targets when opening buys or sells. Take Profit levels can be placed around them.
Red lines represent channels or trend lines that show the current trend and indicate the direction in which it is preferable to trade now.
The MACD indicator (14,22,3) – the histogram and the signal line – is a supporting indicator that can also be used as a source of signals.
Important speeches and reports (always included in the news calendar) can significantly affect the movement of the currency pair. Therefore, during their release, trading should be done with utmost caution, or traders should exit the market to avoid sharp price reversals against the previous movement.
Beginning traders in the forex market should remember that not every trade can be profitable. Developing a clear strategy and effective money management are the keys to long-term trading success.


