यह भी देखें

 28.04.2026 05:42 PM
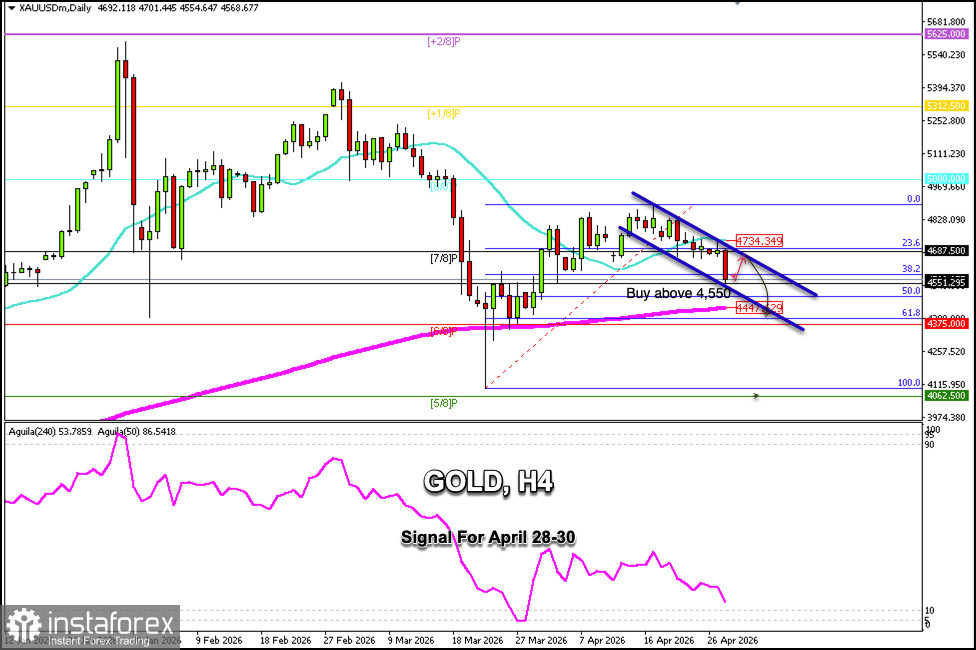
Gold is trading around $4,568, undergoing a sharp technical correction after consolidating for about seven days around the $4,700 level. Gold is expected to continue falling in the coming days until it reaches the 200-day EMA around $4,447 or the 61.8% Fibonacci retracement level at $4,300.
Gold has reached the key support level from March 27. If it consolidates above $4,650 in the coming hours, we could expect a recovery toward the 21 SMA at $4,734.
Given that gold is under bearish pressure, a pullback toward the 38.2% or 23.6% Fibonacci retracement levels could be considered a signal to continue selling in the coming days.
The daily gold chart shows bearish potential, and any technical rebound in the coming days could be viewed as an opportunity to sell until the 6/8 Murray target is reached, around $4,375.
According to the daily chart, gold has reached the lower band of the downtrend channel; if this support holds, we could expect a technical rebound toward the upper band of the trend channel around $4,645.
If this key support level proves to be strong, we could look for opportunities to buy gold above $4,550, with targets at 4,600 and 4,645, before the main downtrend resumes.
A decisive break above the 23.6% Fibonacci level and above the 21-day SMA could mark the start of a gold rally, and we could expect it to return to the $4,800 level; it could even reach the 8/8 Murray level around $5,000.
You have already liked this post today
*यहां पर लिखा गया बाजार विश्लेषण आपकी जागरूकता बढ़ाने के लिए किया है, लेकिन व्यापार करने के लिए निर्देश देने के लिए नहीं |

