
यह भी देखें


 23.09.2026 07:10 AM
The 4-hour (H4) chart for Gold (XAU/USD) shows the price stabilizing within a consolidation pattern following its successful exit from the previous bearish wave. Gold is currently trading at 4343.67, holding above the Weekly Pivot point.
Technical Analysis and Price Action
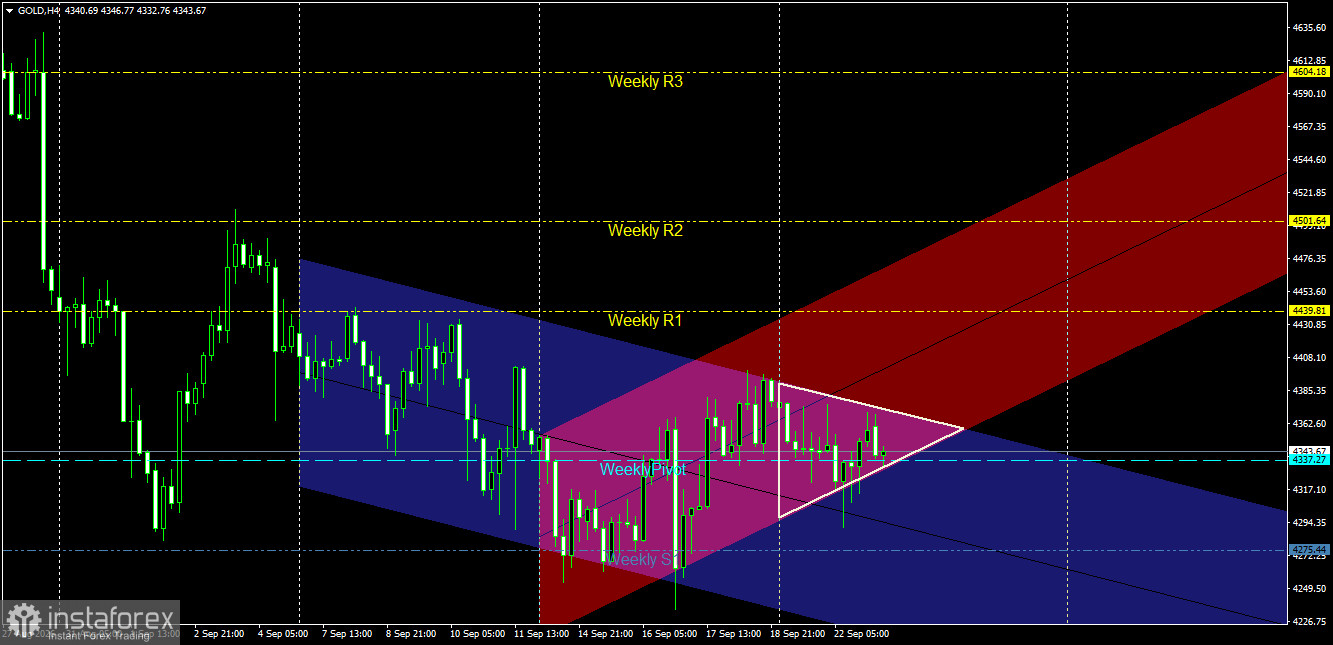
Rebound and Formation of an Ascending Channel: After establishing a strong pivotal low at the first weekly support level (Weekly S1) at 4275.44, buyers regained momentum. The price broke out of the primary bearish channel (blue) and is now moving within a secondary ascending channel (red/pink).
Symmetrical Triangle Formation: The price is currently experiencing sideways fluctuation and low liquidity, resulting in the formation of a continuation symmetrical triangle pattern within the boundaries of the red ascending channel. The price is currently pressing near the Weekly Pivot point at 4337.27; this serves as a pivotal level that will determine the next trend direction once the triangle's boundaries are breached.
Pivotal Support and Resistance Levels
Key Resistance Levels:
Resistance 1: The upper boundary of the symmetrical triangle, followed by the 4439.81 level (Weekly R1).
Resistance 2: The 4501.64 level (Weekly R2).
Key Resistance: The 4604.18 level (Weekly R3).
Key Support Levels:
Support 1: The 4337.27 level (Weekly Pivot and the lower boundary of the current triangle).
Support 2: The 4275.44 level (Weekly S1 and the primary low). Price Action Outlook and Trading Recommendations
Bullish Scenario (Primary):
A bullish breakout from the triangle pattern, followed by continued movement within the red ascending channel, is the most likely scenario as long as the price maintains trading above the 4337.27 level.
Recommendation: Buy following a direct breakout above the triangle's upper boundary, or upon a pullback near the weekly pivot level.
Technical Targets: Move towards the first weekly resistance level at 4439.81 as an initial target; a breakout here would drive the price to extend towards 4501.64.
Stop Loss: A 4-hour candle close below the 4320.00 level.
Bearish Scenario (Alternative):
This scenario is triggered if the price breaks below the triangle's lower boundary and stabilizes below the weekly pivot level.
Validation Condition: Breaking the 4337.27 level and closing a 4-hour candle below it.
Technical Targets: A return to retest the first weekly support level at 4275.44.
Risk Management
It is advisable to wait for a 4-hour candle to close outside the triangle pattern boundaries to confirm the breakout direction and avoid false breakouts, while strictly adhering to a risk limit of 1% to 2% of capital per trade.
The H1 chart for Gold (GOLD) prices indicates continued trading within a short-term bearish corrective range; the price is currently hovering around 4342.69, anchored near key pivot levels and confined within bearish price channels.
Technical Analysis and Price Action
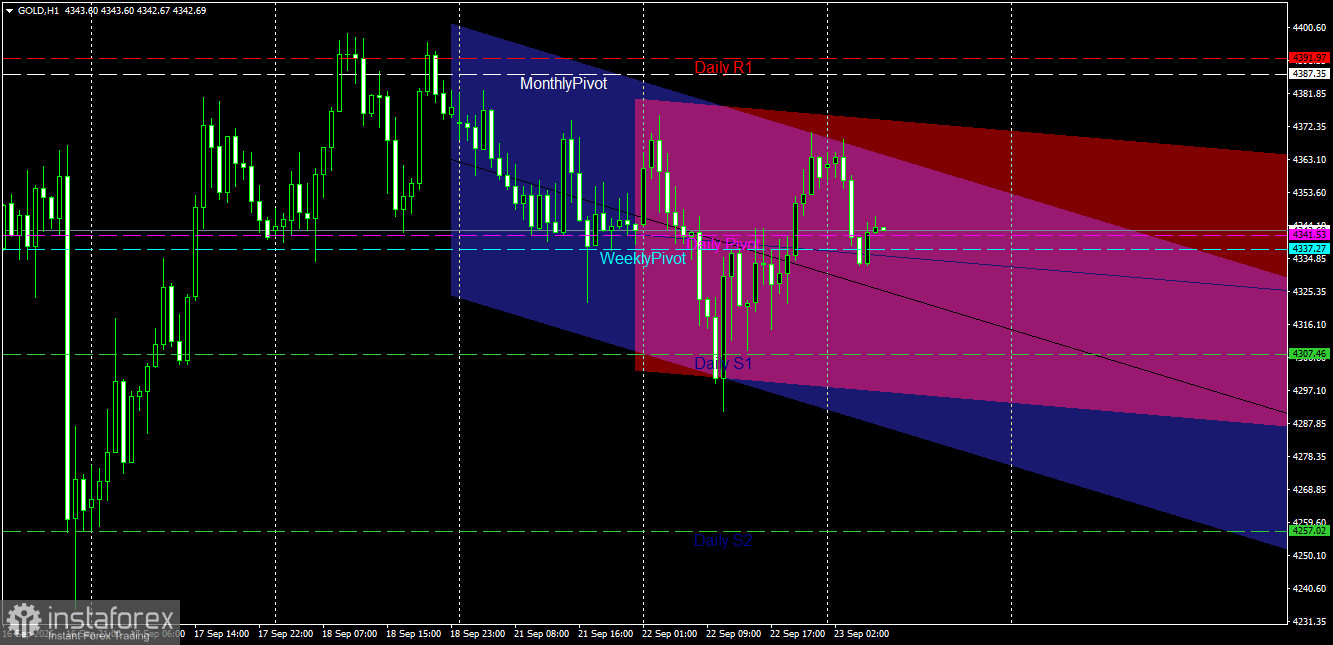
Bearish Channel Structure: Gold is currently trading within a primary bearish channel (blue) and an accelerated secondary bearish channel (pink/red). After establishing a local peak near the first daily resistance level (Daily R1) at 4391.97 and the monthly pivot level at 4387.35, the price underwent a decline followed by prolonged sideways fluctuation around the channel's midline.
Consolidation Around Pivot Levels: The price is moving within a very narrow zone between the Daily Pivot at 4341.53 and the Weekly Pivot at 4337.27. This fluctuation reflects indecision between buying and selling forces, pending a decisive breakout to determine the next directional move.
Key Support and Resistance Levels
Key Resistance Levels:
Resistance 1: The range between 4387.35 and 4391.97 (Monthly Pivot and Daily R1).
Resistance 2: The 4400.60 level (previous peak and psychological barrier).
Key Support Levels:
Support 1: The pivotal range between 4341.53 and 4337.27 (Daily Pivot and Weekly Pivot). Second Support: 4307.46 (Daily S1).
Key Support: 4257.02 (Daily S2).
Price Action Outlook and Trading Recommendations
Bearish Scenario (Primary):
A continued decline is the most likely scenario as long as the price remains within the pink bearish channel and below key resistance zones.
Recommendation: Sell if the price holds below 4341.53 or upon a retest of the channel's upper boundary.
Technical Targets: Breaking the weekly pivot at 4337.27 would drive the price toward the first daily support at 4307.46 (first target), extending to 4257.02 (second target).
Stop Loss: A one-hour candle close above 4360.00.
Bullish Corrective Scenario (Alternative):
This scenario activates if buyers successfully break out of the bearish channel and rise above key pivot levels.
Validation Condition: Breaking out of the pink channel and holding above 4353.60 with a full one-hour candle close.
Technical Targets: Retesting the monthly pivot and the first daily resistance at 4387.35 – 4391.97.
Risk Management
It is advisable to monitor price action near the pivot levels of 4337.27 – 4341.53 before making a decision, while strictly adhering to stop-loss orders and limiting risk to no more than 1%–2% of total capital per trade.

