
यह भी देखें


 09.11.2026 06:21 PM
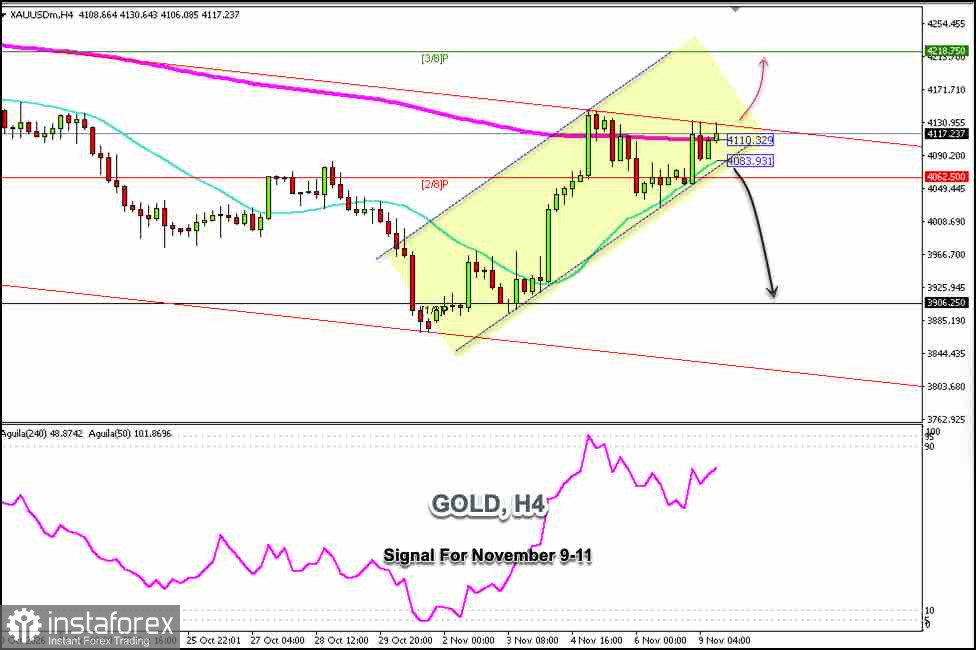
Gold is trading around $4,117 within the downtrend channel that has been forming since October 18, attempting to consolidate above the 200-period exponential moving average (EMA) while also making a third attempt to break out of that downtrend channel.
If gold consolidates above $4,130 in the coming hours, the uptrend will go ahead until the price reaches the Murray 3/8 level, around $4,218. This could then be interpreted as a clear signal to open short positions, as the H4 chart technically indicates the instrument is about to reach overbought levels.
On the other hand, if gold falls and decisively breaks below the secondary uptrend channel formed since early November—and breaks below the 21-period simple moving average (SMA) at $4,083— this could be interpreted as a negative signal, and gold could pull back toward the Murray 1/8 low, around $3,906.
We may be observing the formation of a symmetrical triangle, as a decisive break above the 200-period exponential moving average (EMA) will be interpreted as a signal to exercise caution. So, a decisive break below the 21-period simple moving average (SMA) will be considered a sell signal—potentially even reaching $3,873, the level where the price stood on October 29 when it left a gap—which could be the target for bears.
The Eagle indicator is approaching overbought levels; technically, we could look for opportunities to sell below 3/8 of Murray or below the 200 EMA, and a downtrend could develop if the price falls below 2/8 of Murray.
You have already liked this post today
*यहां पर लिखा गया बाजार विश्लेषण आपकी जागरूकता बढ़ाने के लिए किया है, लेकिन व्यापार करने के लिए निर्देश देने के लिए नहीं |

