
यह भी देखें


 27.07.2026 10:40 AM
On Friday, the EUR/USD pair continued to decline below the 23.6% Fibonacci retracement level at 1.1395, but on Monday night it sharply reversed in favour of the euro and consolidated above the 1.1395 level. Therefore, the upward move may continue today towards the next retracement level at 38.2% – 1.1438. A renewed consolidation below 1.1395 would again favour the US dollar and could lead to a decline towards the 0.0% Fibonacci level at 1.1325.
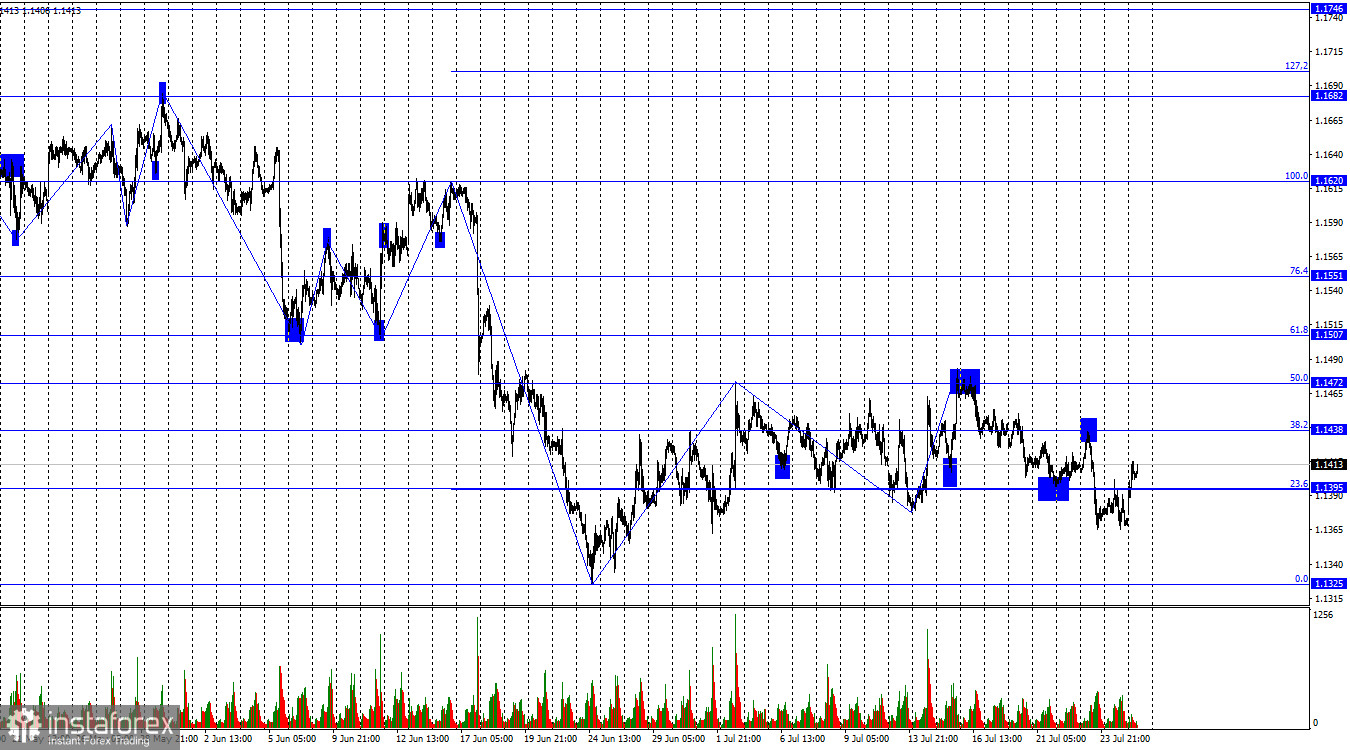
The wave structure on the hourly chart remains bearish, despite the prolonged (but weak) advance by buyers. The latest completed upward wave exceeded the previous peak by only a few pips, while the most recent downward wave broke below the previous low. The geopolitical situation is deteriorating again, as Iran and the United States have resumed blockades in the Strait of Hormuz and active military operations. A conclusion that the bearish trend has ended can only be made after the price breaks above the 1.1473 peak, but bulls have demonstrated weakness for a month already.
Friday's fundamental backdrop once again favoured buyers. US business activity indices were mixed, and in any case, traders generally prefer to focus on the ISM indices rather than the S&P Global PMI data. Meanwhile, business activity indices in the eurozone services and manufacturing sectors exceeded market expectations. As a result, the euro had the opportunity to post a strong advance on Friday, but once again buyers failed to launch a meaningful attack.
Overnight, markets actively reacted to developments in the Middle East. Donald Trump appears to have either lost patience or become frustrated, but he once again "gave Iran a chance" to resolve the conflict peacefully. At present, Iran has not issued any statements indicating a willingness to resume dialogue with the United States, although Trump believes that Tehran is the party interested in negotiations. Therefore, missile strikes have temporarily stopped, but the Strait of Hormuz remains closed, and whether negotiations will resume remains uncertain.
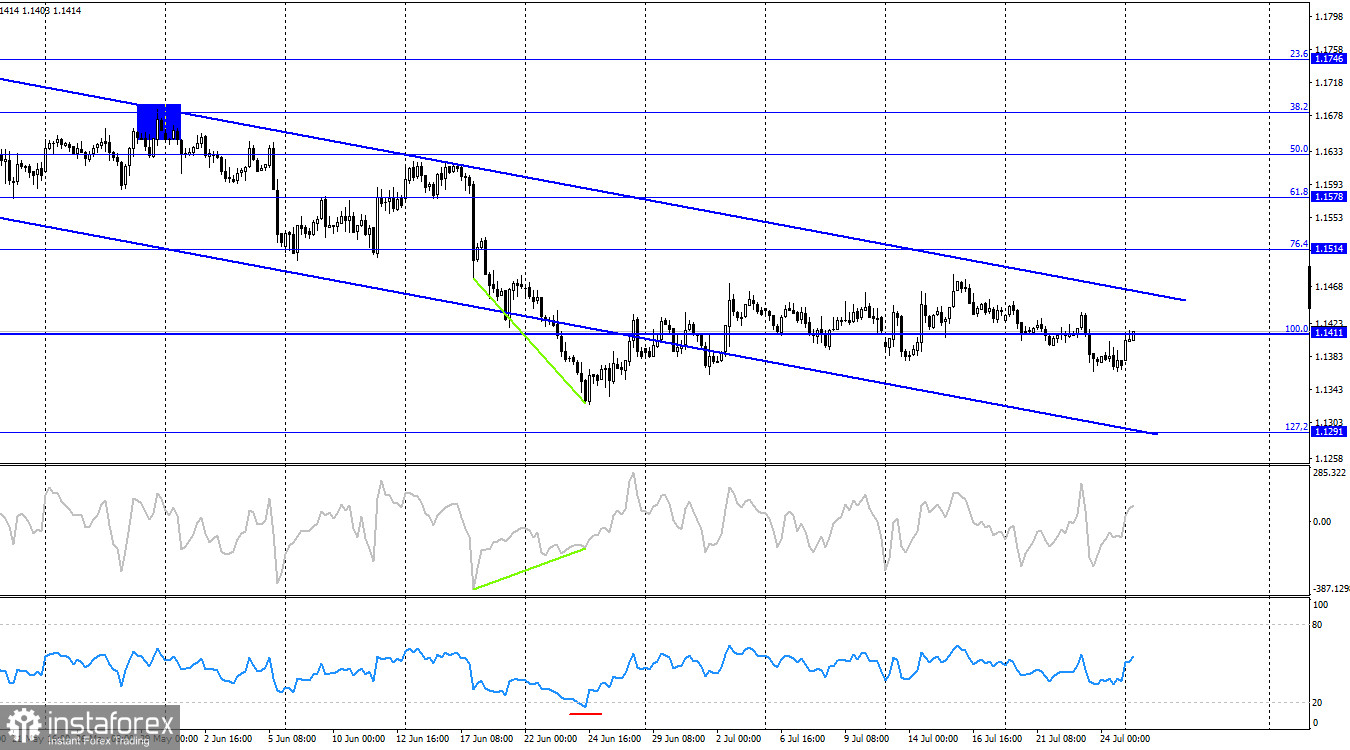
On the 4-hour chart, the pair is moving sideways. A consolidation below 1.1411 would suggest further downside potential; however, the price has changed direction too frequently recently, while traders have shown limited activity. No developing divergences are currently visible on any technical indicators. The downward trend channel remains valid.
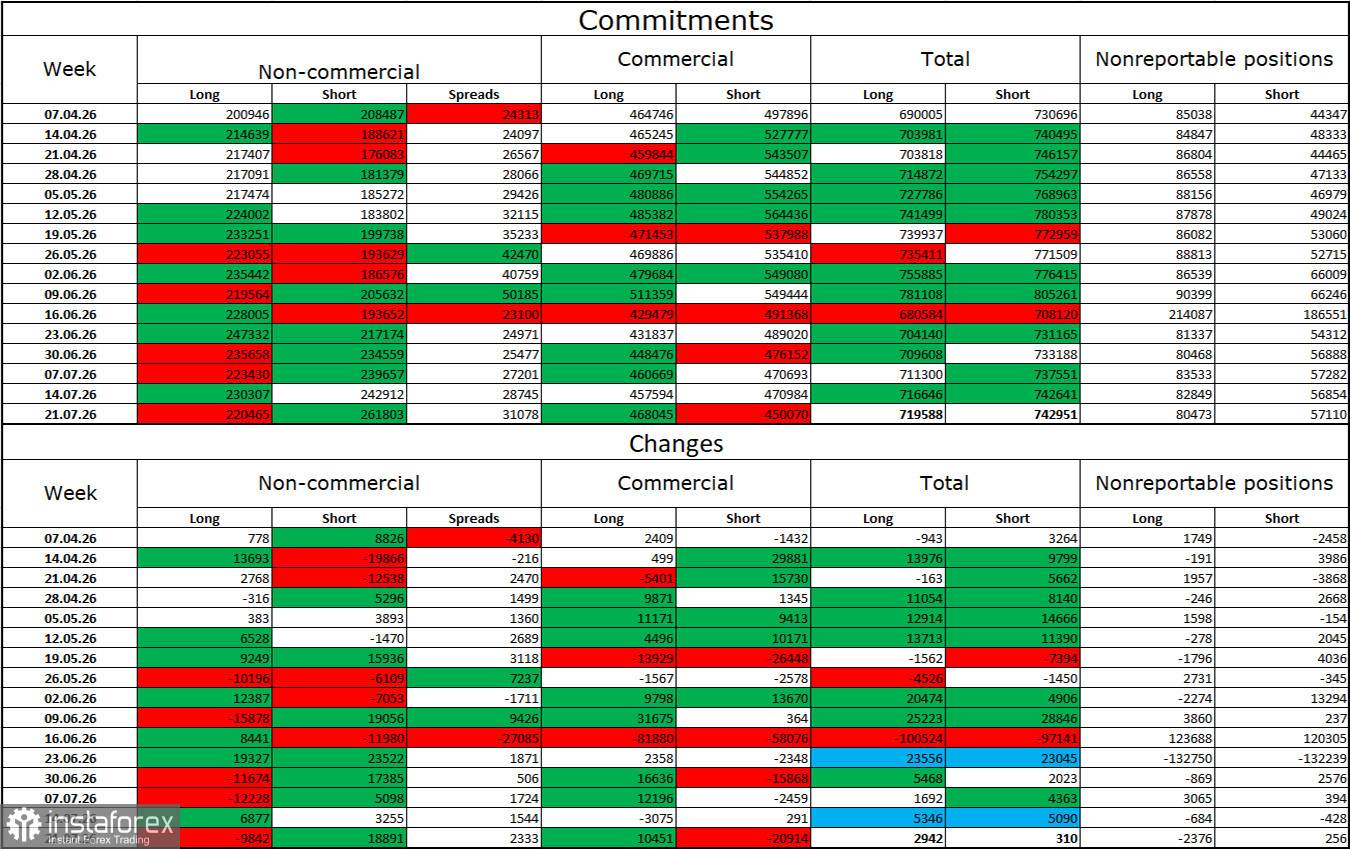
During the latest reporting week, institutional traders closed 9,842 Long positions and opened 18,891 Short positions. Over the seven weeks in February and March, the strong bullish advantage disappeared due to the war involving Iran, while during the following seventeen weeks the market became more balanced amid a temporary ceasefire and hopes that the conflict would end.
The total number of Long positions held by speculators currently stands at 220,000, while Short positions amount to 261,000. Bears have once again taken the lead.
Overall, in the longer term, large market participants continue to show significant interest in the euro. Naturally, global events of various kinds — which have been abundant in recent years — continue to influence investor sentiment. In particular, markets are currently closely monitoring developments in the Middle East, where the conflict appears to end and then resume repeatedly. Initially, markets ignored the ceasefire, and later they also largely ignored the resumption of hostilities. Therefore, geopolitical factors no longer determine the fate of the US dollar on their own.
Germany
United States
The economic calendar for 26 July contains two releases that are unlikely to attract significant attention. At present, bullish traders are ignoring most economic news, while bearish traders continue to sell without fundamental support. The impact of economic data on market sentiment on Monday is expected to be very limited or absent.
Buy: Long positions were possible after a close above 1.1395, with targets at 1.1438 and 1.1472. These trades can remain open today.
Sell: Short positions may be considered after a consolidation below 1.1395 on the hourly chart or following a rejection from 1.1438, with a target of 1.1325.
Fibonacci retracement levels are drawn from 1.1620 to 1.1325 on the hourly chart and from 1.1411 to 1.1850 on the 4-hour chart.

