Lihat juga

 22.12.2025 04:08 AM
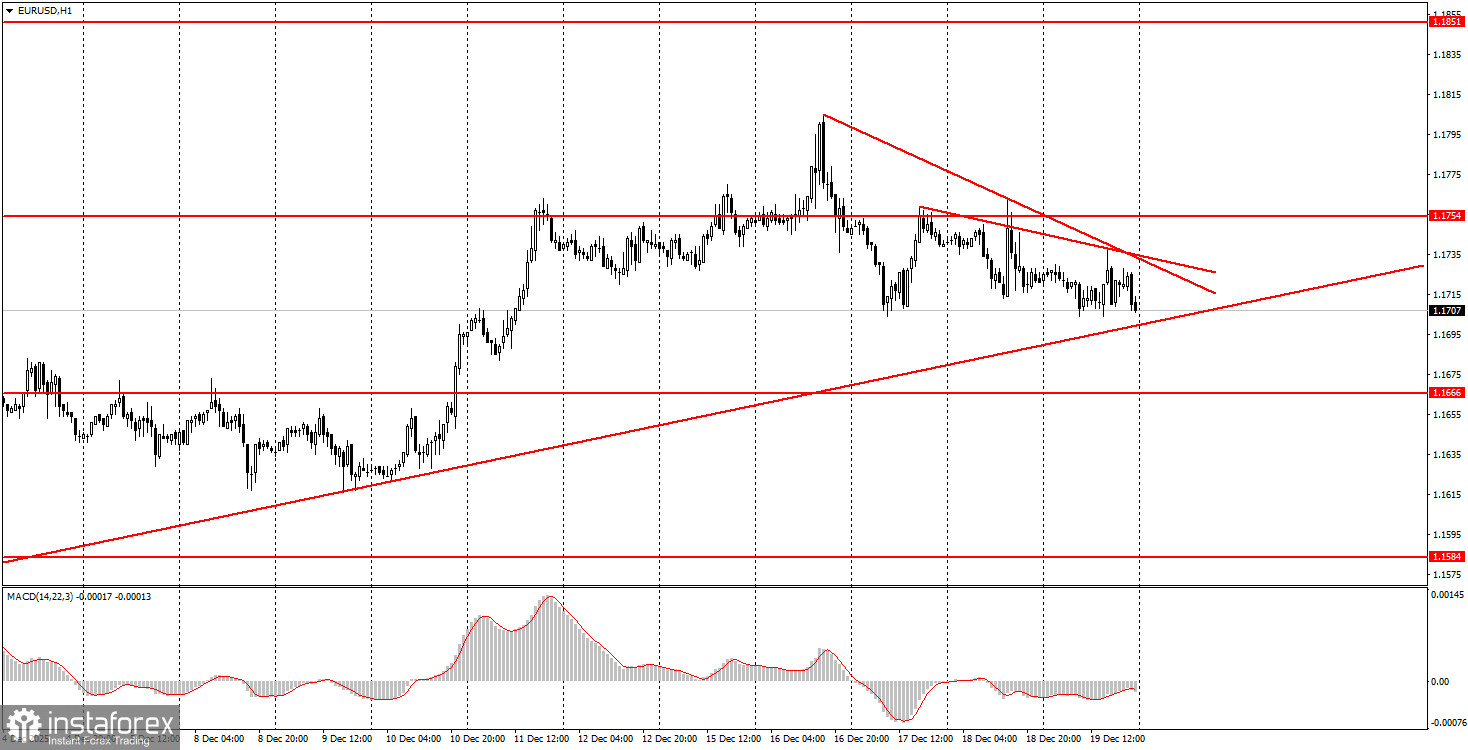
The EUR/USD currency pair remained stagnant on Friday. The overall volatility for the day was around 30 pips, which essentially indicates a complete lack of movement. It is worth noting that a significant number of crucial macroeconomic data were published that week, along with two central bank meetings (the European Central Bank and the Bank of England). Now, let's look at the charts. Does it feel like the fundamental and macroeconomic background over the past five days was super important? Essentially, the EUR/USD pair showed good movement only on Wednesday evening and Thursday night. During this time, the quotes dropped by 100 pips, and there were no more interesting movements throughout the week. Moreover, the 100-pip drop was largely driven by technical factors—specifically a rebound from the upper boundary of the range. On the daily timeframe, the pair remains within the sideways channel of 1.1400-1.1830, which continues to explain the weak volatility. On Friday, there were almost no significant events, so the market essentially left for the weekend early, barely noticing the University of Michigan consumer sentiment index. In general, we can only conclude that the flat market on the daily timeframe continues, and that says it all.
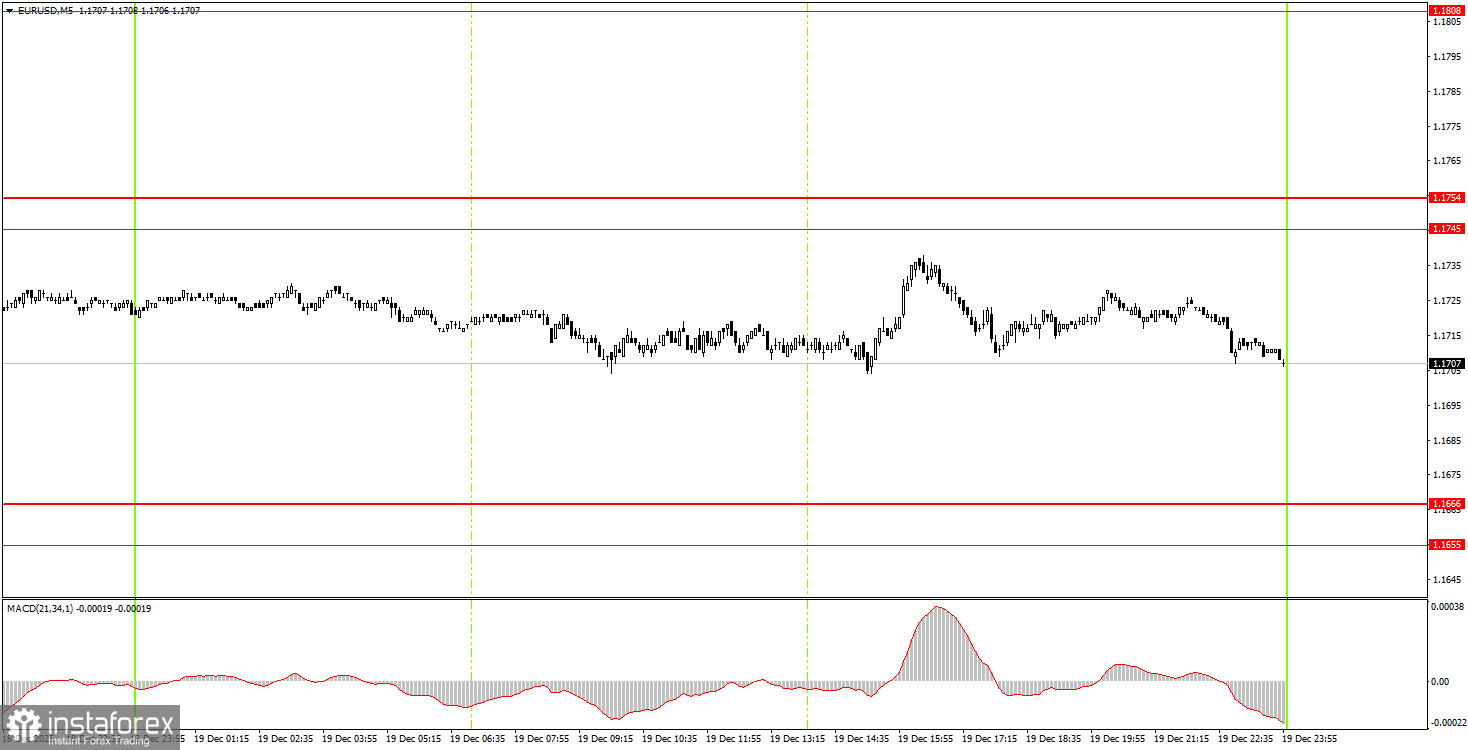
On the 5-minute time frame, no trading signals were formed on Friday, which is not surprising given the overall volatility of 34 pips. Throughout the day, the price did not attempt to work out any level or area.
On the hourly timeframe, the EUR/USD pair continues to develop an upward trend. Over the past few days, two short-term trend lines have formed, and a breakout of these lines will indicate a resumption of the primary trend. In this case, there will be a new attempt to test the 1.1800-1.1830 area, which is the upper boundary of the flat on the daily timeframe. The overall fundamental and macroeconomic backdrop remains very weak for the U.S. dollar; thus, we expect further growth of the pair. The price reached the upper line of the sideways channel at 1.1400-1.1830, so now it needs either to break through it or the flat will persist.
On Monday, beginner traders can trade from the areas of 1.1745-1.1754 and 1.1655-1.1666. There will be a few news releases on that day, so volatility may again be very weak.
On the 5-minute timeframe, levels to consider include 1.1354-1.1363, 1.1413, 1.1455-1.1474, 1.1527-1.1531, 1.1550, 1.1584-1.1591, 1.1655-1.1666, 1.1745-1.1754, 1.1808, 1.1851, 1.1908, and 1.1970-1.1988. No significant events are scheduled in the Eurozone or the U.S. for Monday, so significant movements are unlikely.
Important Note: Significant speeches and reports (always included in the news calendar) can greatly influence the movement of the currency pair. Therefore, during their release, it is advisable to trade cautiously or exit the market to avoid sharp reversals against the preceding movement.
Remember: For beginners trading in the Forex market, it is important to understand that not every trade can be profitable. Developing a clear strategy and practicing money management are keys to long-term trading success.


