Lihat juga

 30.12.2025 04:46 AM
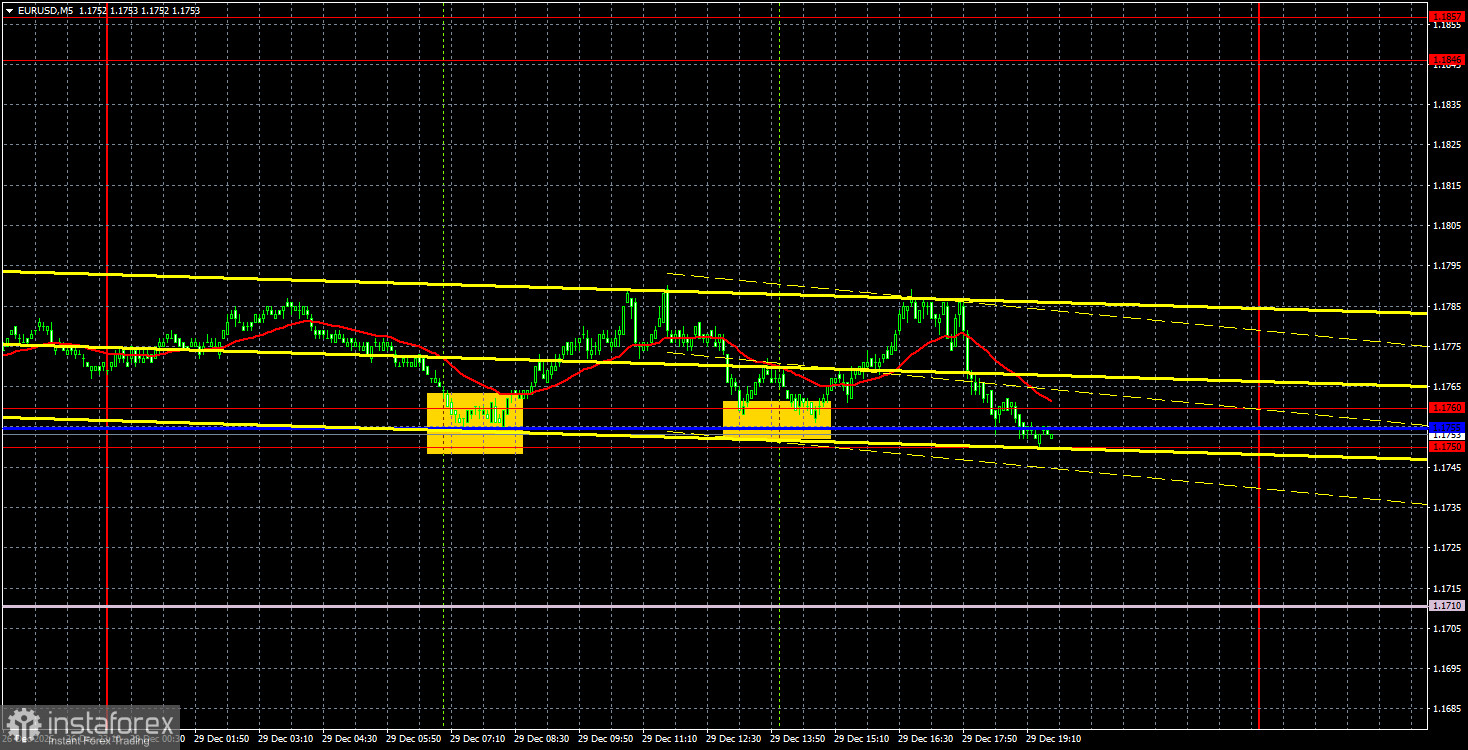
The EUR/USD currency pair traded with minimal volatility on Monday. This is not surprising given that Christmas and New Year celebrations are ongoing worldwide. There are more days off, and traders have less desire to trade, with no macroeconomic or fundamental background available. Thus, strong, trending moves are unlikely before the end of the year. This week, the event calendar for the Eurozone and the US is empty.
From a technical perspective, an upward trend persists on the hourly timeframe, as indicated by the trend line. We consider the primary task for the euro this week is to remain above this trend line to continue the upward movement at the beginning of next year without reversing the bullish trend. The European currency is also supported by Ichimoku indicator lines. A rebound from the 1.1750-1.1760 area today could provoke a slight rise in the pair.
On the 5-minute timeframe, two trading signals were formed on Monday, which is not unusual. However, these signals are not surprising, given the market's total flatness and the price being near an important area and the Kijun-sen line. The price rebounded twice from these areas and lines on the first trading day of the week. In both cases, the price moved up by about 20-25 pips.
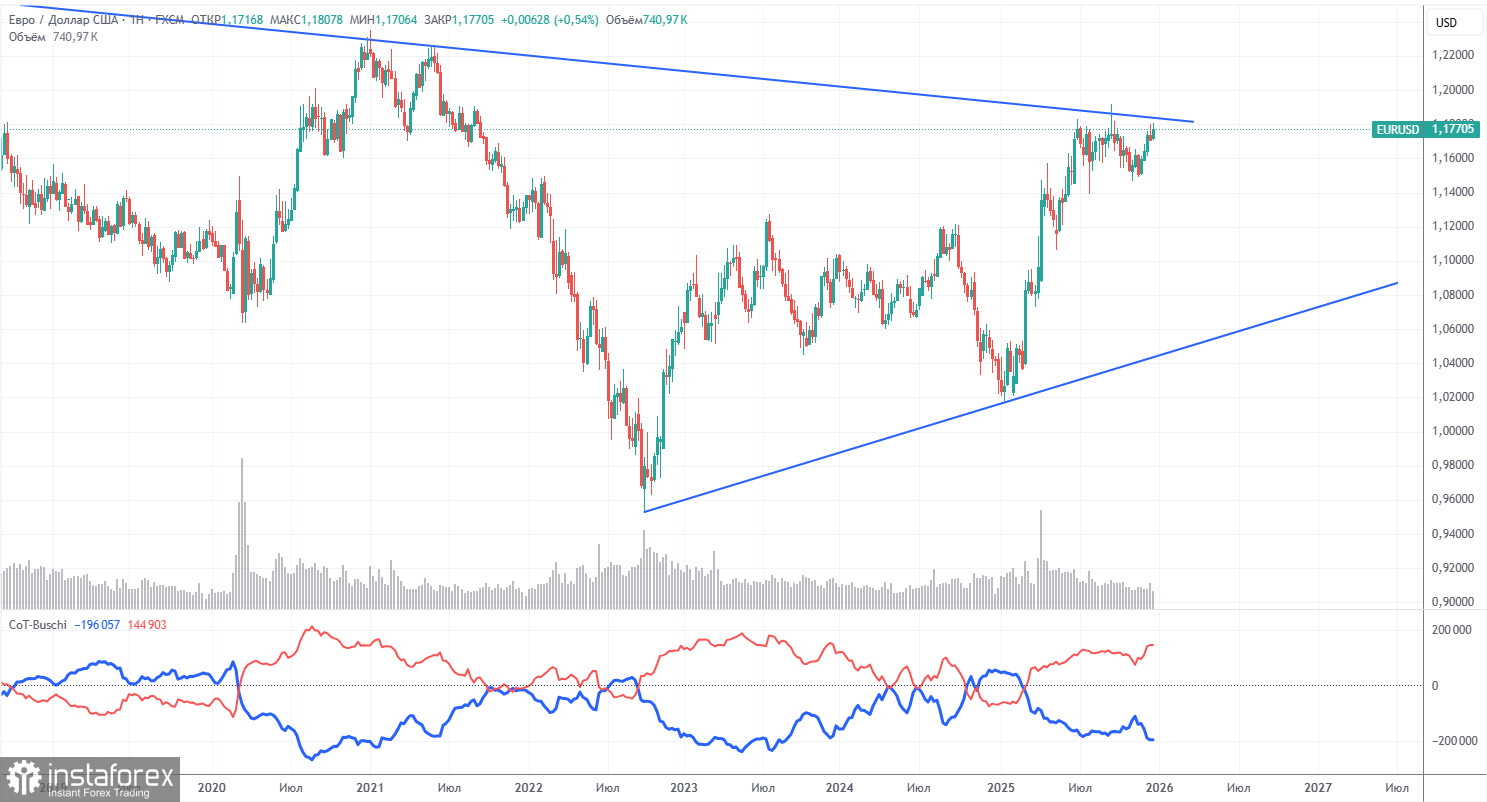
The latest COT report is dated December 16. The illustration above shows that the net position of non-commercial traders has been "bullish" for a long time. The bears struggled to gain the upper hand at the end of 2024 but quickly lost it again. Since Trump took office for the second time, only the dollar has been falling. We can't say with 100% certainty that the decline of the US currency will continue, but current global developments suggest this is a possibility. The red and blue lines are diverging, indicating a strong advantage for the bulls.
We still do not see any fundamental factors supporting the strengthening of the European currency, but there are still plenty of reasons for the American dollar to fall. The global downward trend persists, but what significance does it have given the price movements over the last 17 years? The European currency has been growing for the last three years, and that is a trend.
The arrangement of the red and blue lines of the indicator continues to indicate the maintenance and strengthening of the bullish trend. During the last reporting week, the number of longs for the "Non-commercial" group increased by 8,900, while the number of shorts rose by 2,700. Accordingly, the net position increased by 6,200 contracts over the week.
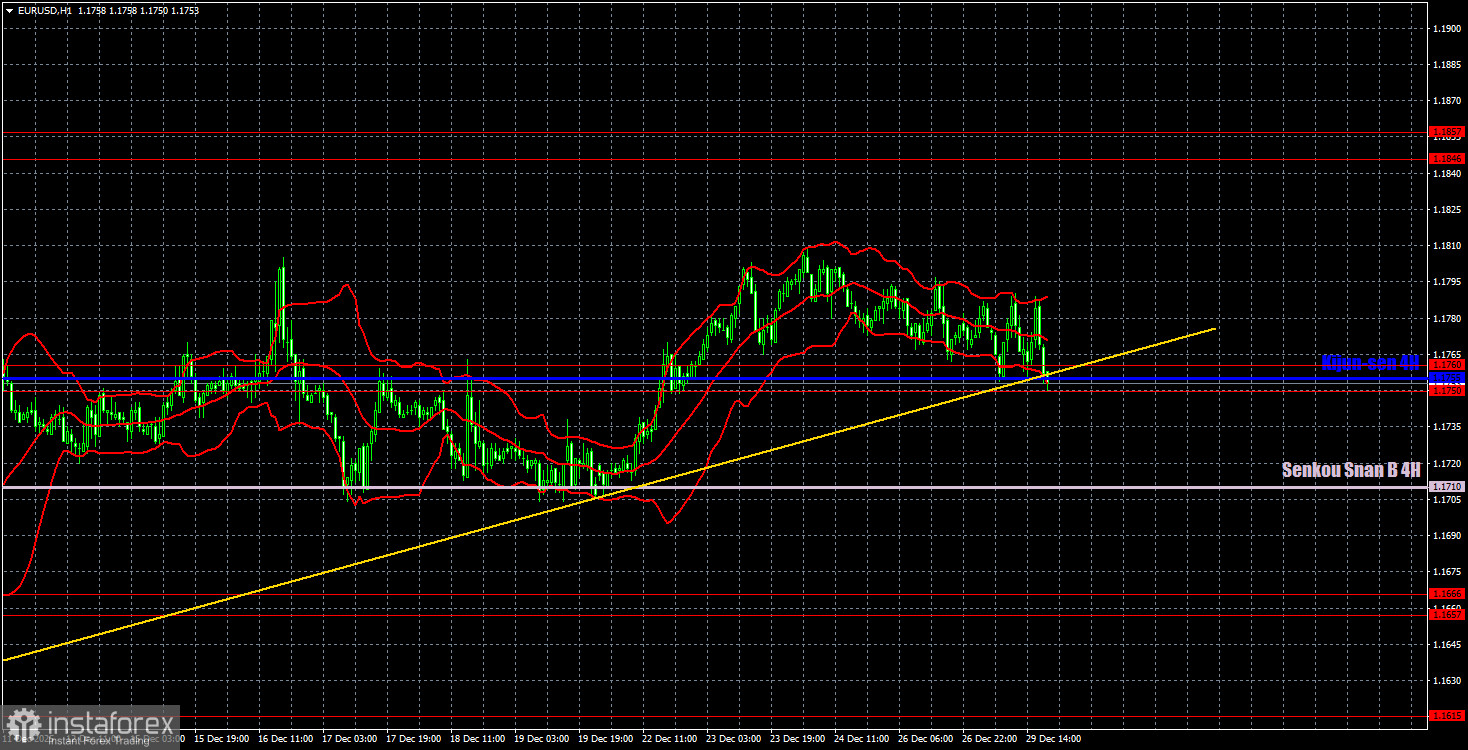
On the hourly timeframe, the EUR/USD pair maintains its upward trend. The upper line of the lateral channel at 1.1400-1.1830 has been tested twice, so we might soon witness a technical pullback, as the flat trend continues on the daily timeframe. However, the 1.1750-1.1760 area is preventing the pair from dropping lower, and the ascending trend line maintains the local trend, interrupted by the holidays.
For December 30, we highlight the following levels for trading: 1.1234, 1.1274, 1.1362, 1.1426, 1.1542, 1.1604-1.1615, 1.1657-1.1666, 1.1750-1.1760, 1.1846-1.1857, 1.1922, 1.1971-1.1988, as well as the Senkou Span B line (1.1710) and the Kijun-sen line (1.1755). Ichimoku indicator lines may move throughout the day, which should be taken into account when determining trading signals. Don't forget to set stop loss orders to breakeven if the price moves in the correct direction by 15 pips. This will protect against potential losses if the signal turns out to be false.
On Tuesday, there are no significant events or reports planned in the Eurozone or the US. Movements may be weak throughout the day and non-trending.
On Tuesday, traders may trade from the 1.1750-1.1760 area. A price rebound from this area would make long positions relevant, targeting the 1.1800-1.1830 area. A consolidation below this area would lead to a drop with a target set at the Senkou Span B line.


