
Lihat juga


 03.11.2026 02:26 PM
*see also: InstaTrade trading indicators for the S&P 500 (SPX)
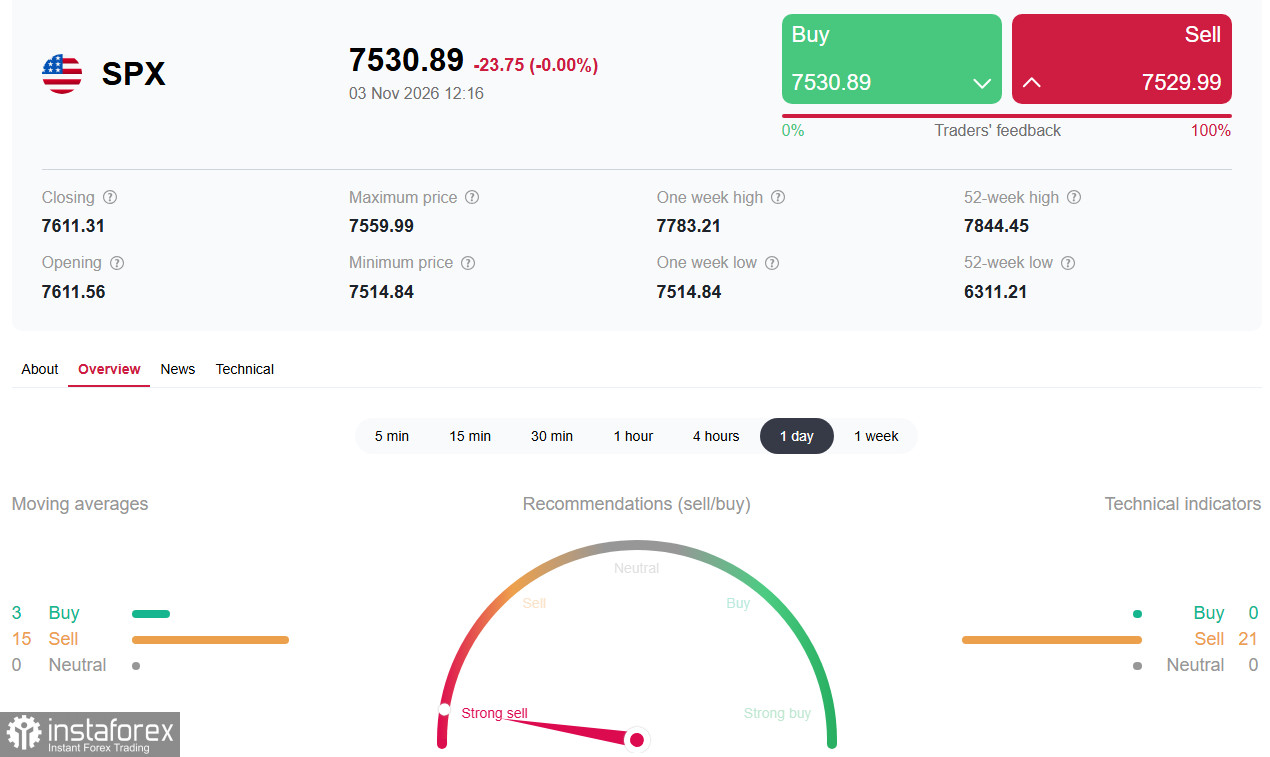
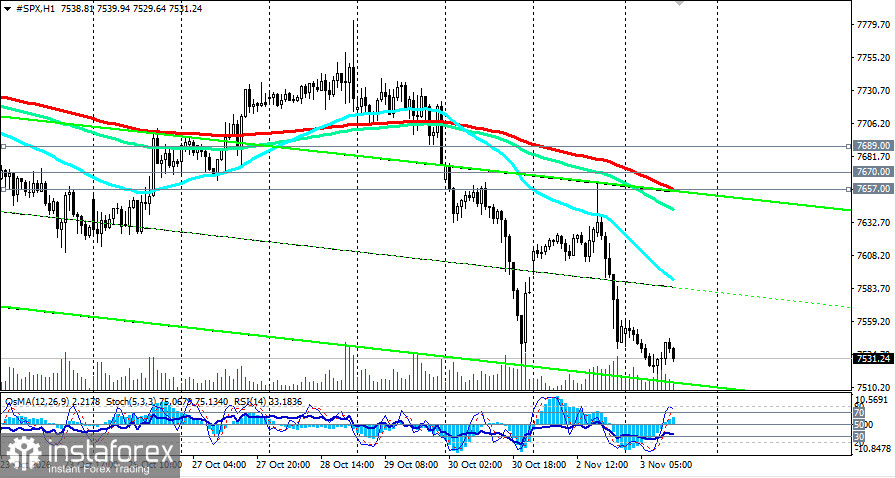
The S&P 500 closed Monday lower, while the Dow Jones gained about 0.4% and the Nasdaq fell roughly 1% — a mixed reaction that reflects investor caution ahead of the midterms and uneven corporate results. Futures trade lower on Tuesday. Ahead of the US session opening on Tuesday, November 3, 2026, S&P 500 futures are around 7,530–7,540 as the index attempts to hold after a 0.51% close-down the prior day. The market is in a tense wait-and-see mode: today's US midterms will set the political balance for the next two years, and a slate of labor releases beginning with JOLTS will provide the first clues about whether the economy is cooling enough for the Fed to soften its rhetoric. Technically, the chart is fragile: the index trades below key moving averages, and momentum indicators offer little cause for optimism.
Elections will shape the political landscape. Final polling averages show Democrats favored in contests for the House (about 239 seats vs. 196 for Republicans) and a Senate edge (53 vs. 47). Deutsche Bank notes that even control of a single chamber would have material consequences for the legislative agenda of the Trump administration, especially around spending and the debt ceiling. For equities, the market is focused on two outcomes: the risk of political gridlock and the prospect of tougher AI regulation.
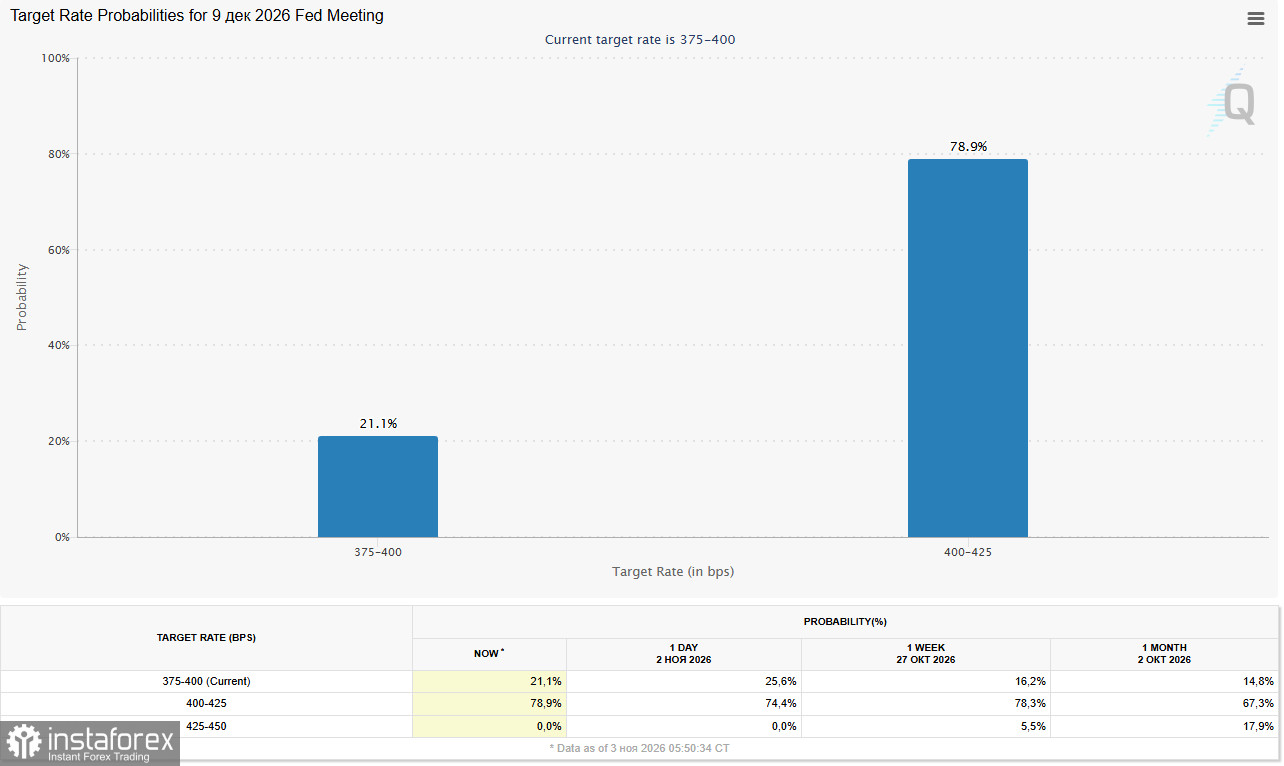
Labor data comes into focus. At 15:00 GMT today, the September JOLTS report is due. Consensus expects job openings to rise to about 7.134 million from 7.079 million in August. Strong JOLTS would confirm labor market resilience and bolster bets on a December Fed hike (markets price in roughly a 75–80% probability). Softer readings, by contrast, could give equities a welcome reprieve.
InstaTrade's composite technical scan (daily chart) signals "Strong Sell": 21 of 23 applied indicators favor sellers.
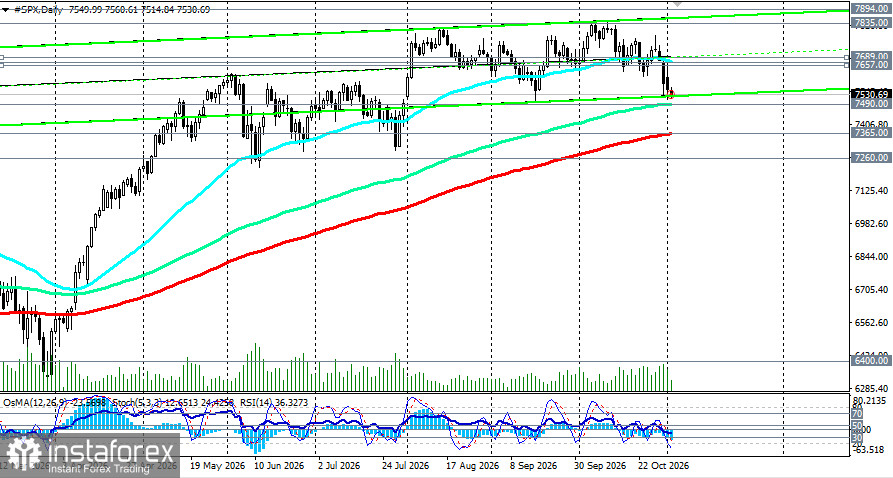
Short-term technical weakness persists, but the structure looks more coherent when viewed through daily moving averages.
The index is trading above the 144-day EMA (7,490.00) and above the 200-day EMA (7,365.00), which preserves the medium-term bullish trend. However, the price sits below the 50-day EMA (7,670.00), indicating a loss of mid-term momentum.
The S&P 500 is pausing ahead of elections and labor data. The long-term technical backdrop remains constructive, while the short-term picture is fragile. Key levels: bulls need 7,657.00 (H1 EMA200); bears eye 7,490.00 (D1 EMA144); critical long-term support sits at 7,365.00 (D1 EMA200).
For short-term traders:
For medium-term investors:
Risk management:
The key defensive line for bulls is 7,490.00. As long as that level holds, the current pullback should be treated as a correction.


