یہ بھی دیکھیں

 26.06.2023 12:10 PM
Bitcoin
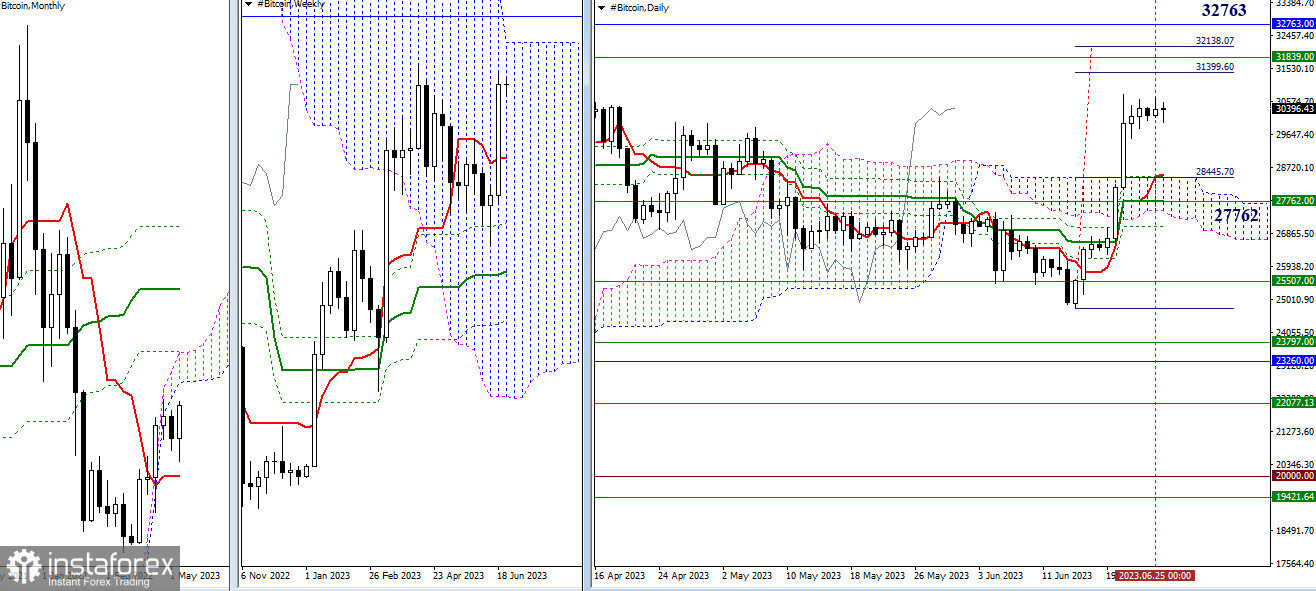
Higher timeframes
As June nears its end, bulls attempt to overcome the pause of the past few months and regain their positions. The nearest bullish targets on this path can be identified as the all-time high (31,044), the daily target for breaking the cloud (31,400 - 32,138), the upper boundary of the weekly cloud (31,839), and the lower boundary of the monthly cloud (32,763). Overcoming this cluster of levels, which are different in strength and significance, will create new prospects. If bulls face another failure and the immediate resistances cannot be overcome, bearish sentiments will return to the market.
In such case, the focus will primarily be on breaking the daily cloud (28,439 - 27,502) and the liquidation of the daily golden cross (27,052). The daily levels are currently reinforced by the weekly short-term trend (27,762), so if bears manage to pass the daily obstacles, they will gain control of the weekly short-term trend as well. After implementing one of the possible scenarios and surpassing the mentioned targets, the situation will need to be reassessed.
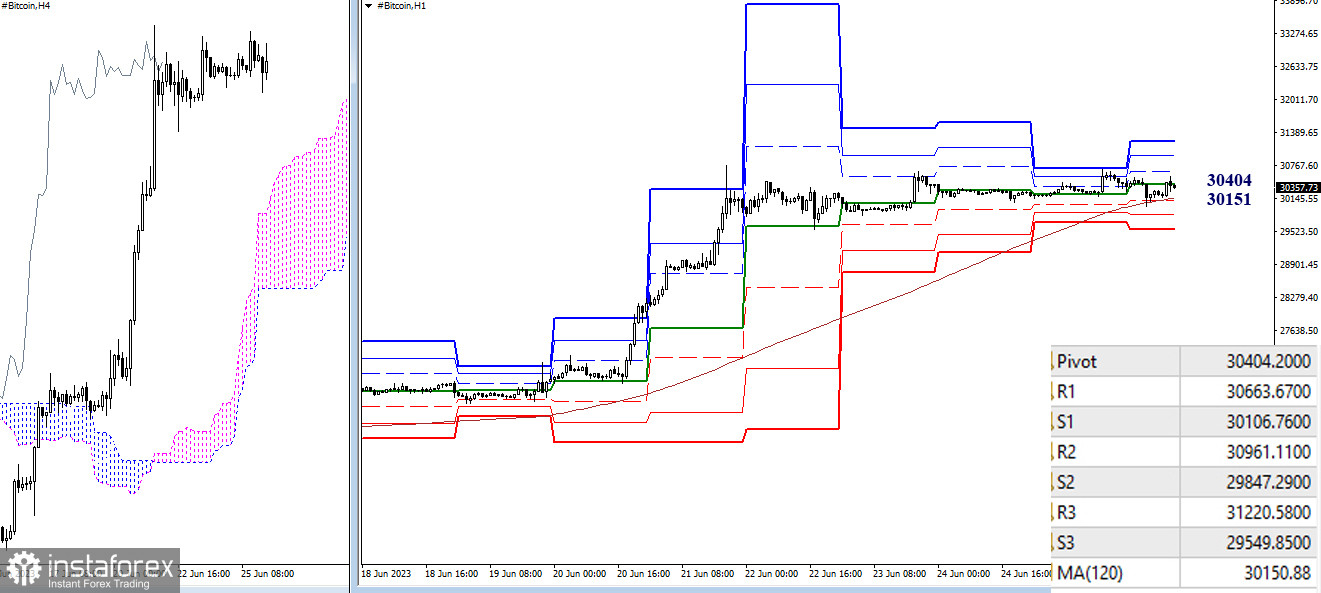
H4 - H1
After an active rise, the pair is now trading sideways, with the central pivot point of the day (30,404) becoming the center of attraction on the lower timeframes. It should be noted that the main level of the lower timeframes (weekly long-term trend) has been rising to meet the price chart every day, and today they intersected. As a result, breaking the weekly long-term trend (30,151) and a reversal of the moving average can change the current balance of power on the lower timeframes in favor of strengthening bearish sentiments. Additional reference points for intraday movement are the classic pivot points. Today they are located at 30,107 - 29,847 - 29,550 (support) and 30,664 - 30,961 - 31,221 (resistance).
The technical analysis of the situation uses:
Higher timeframes - Ichimoku Kinko Hyo (9.26.52) + Fibo Kijun levels
H1 - Pivot Points (classic) + Moving Average 120 (weekly long-term trend)
You have already liked this post today
*تعینات کیا مراد ہے مارکیٹ کے تجزیات یہاں ارسال کیے جاتے ہیں جس کا مقصد آپ کی بیداری بڑھانا ہے، لیکن تجارت کرنے کے لئے ہدایات دینا نہیں.


