empty
30.01.2025 06:56 AM
Bitcoin January 30 - Technical Analysis of the Situation

This image is no longer relevant

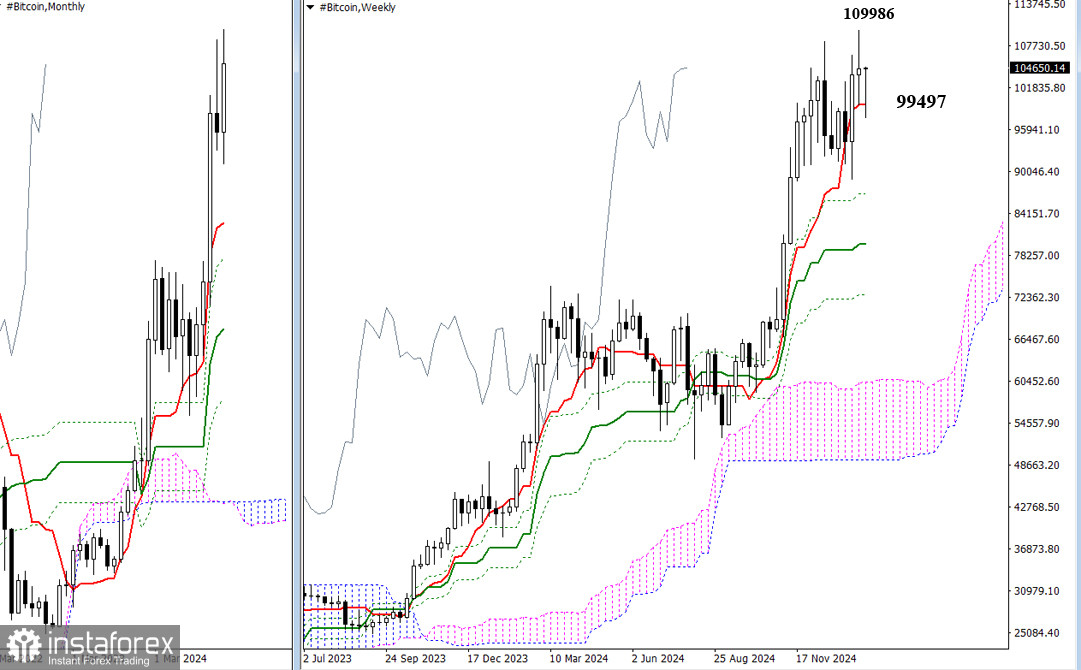
Bitcoin reached a new high last week at 109,986 but has since paused its upward movement, entering a phase of uncertainty. Currently, a long lower shadow has formed on the weekly timeframe, extending down to the short-term trend support level of 99,497. The main question now is whether the bulls will regain control and push prices higher for the remainder of the week, or if uncertainty will continue to dominate.

This image is no longer relevant

In the daily timeframe, the influence of the Ichimoku daily cross (102,383 – 99,497 – 97,021) and the daily cloud (97,538) is contributing to the ongoing uncertainty. If bearish traders manage to break through the established support levels and maintain consolidation below them, new opportunities could arise for them. Conversely, if bulls maintain control and rebound from the current support zone, they might aim to retest the previous high of 109,986 and potentially establish new peaks. In this scenario, the psychological levels of 112000, 113000, 114000, and 115000 will serve as upside targets.

This image is no longer relevant

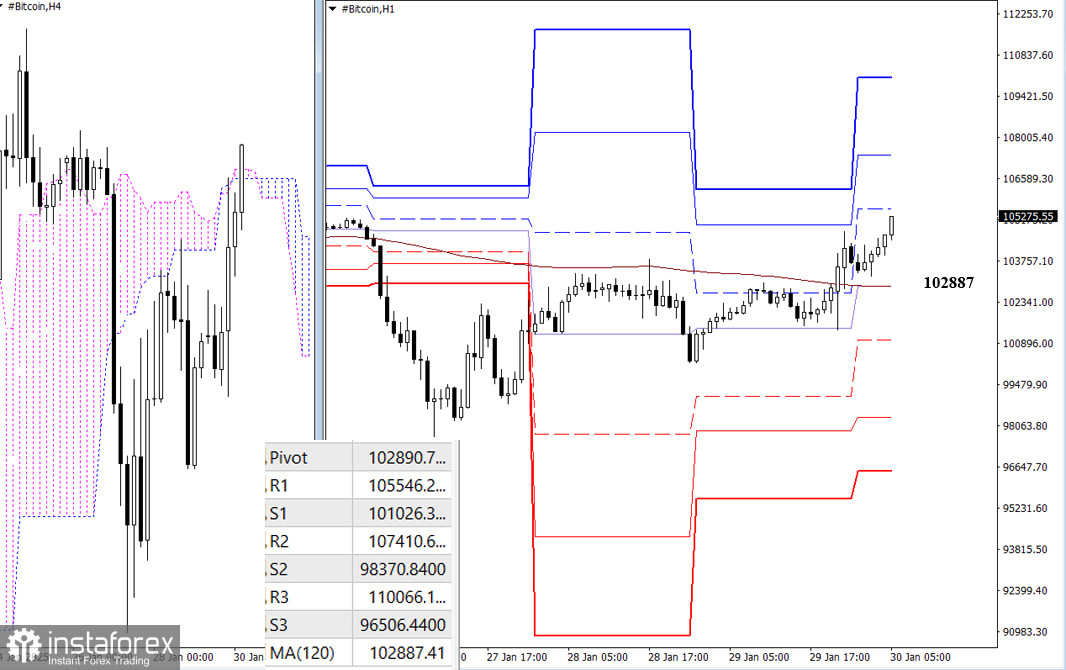
On lower timeframes, Bitcoin has successfully risen above the long-term weekly trend level of 102,887. However, the H4 Ichimoku cloud resistance, which ranges from 104,889 to 104,743, is currently limiting further growth. The key reference points for potential upward movement today are the resistance levels from the classic Pivot points, which can be identified at 105546 - 107411 - 110066. A break above the cloud would signal additional bullish momentum. Conversely, if bearish sentiment takes hold, we could see a rebound from the H4 cloud. This would bring us back to key levels, which today align in the area of 102887. Consolidation below this level, along with a subsequent reversal, would shift momentum in favor of stronger bearish sentiment. The downward reference points in this scenario would be the support levels from the classic Pivot points at 101026 - 98371 - 96506.

***

Technical Analysis Components:
  • Higher Timeframes: Ichimoku Kinko Hyo (9.26.52) and Fibonacci Kijun levels
  • H1: Classic Pivot Points and 120-period Moving Average (weekly long-term trend)

Recommended Stories

سونا : تجزیہ اور پیشن گوئی

یہ کہ $3358 کی سطح سے اوپر کا بریک آؤٹ، جہاں 4 گھنٹے کے چارٹ پر 100 پیریڈ سادہ موونگ ایوریج (ایس ایم اے) واقع ہے، اس ہفتے کے شروع

Irina Yanina 17:24 2025-08-14 UTC+2

جی بی پی / یو ایس ڈی 14 اگست 2025 کو اشارے کا تجزیہ

بدھ کو، جوڑے نے، اوپر کی طرف بڑھتے ہوئے، 1.3587 (ریڈ ڈیشڈ لائن) پر اوپری فریکٹل کا تجربہ کیا اور پھر 1.3571 پر یومیہ موم بتی بند کرتے ہوئے تھوڑا

Stefan Doll 17:14 2025-08-14 UTC+2

ایکس اے یو / یو ایس ڈی : تجزیہ اور پیشن گوئی

تکنیکی نقطہ نظر سے، سونا 4 گھنٹے کے چارٹ پر 200 مدت کے سادہ موونگ ایوریج (ایس ایم اے) سے اوپر رکھنے کا انتظام کر رہا ہے، جو ایک کلیدی

Irina Yanina 19:46 2025-08-12 UTC+2

اگست 12-15 2025 کے لیے یورو / یو ایس ڈی کے لیے تجارتی سگنل: 1.1647 سے نیچے فروخت کریں (200 ای ایم اے - 7/8 مرے)

یورو 1.1618 کے ارد گرد ٹریڈ کر رہا ہے، 200 ای ایم اے کے اوپر اور 6/8 مرے سے اوپر، پچھلے دن کے کچھ نقصانات کو ٹھیک

Dimitrios Zappas 16:22 2025-08-12 UTC+2

12-15 اگست 2025 کے لیے سونے (ایکس اے یو / یو ایس ڈی) کے لیے تجارتی اشارہ: $3,341 سے اوپر خریدیں یا $3,335 سے نیچے فروخت کریں (21 ایس ایم اے - 200 ای ایم اے)

اگر سونا 3,340 سے نیچے آتا ہے تو آؤٹ لک منفی ہو سکتا ہے۔ اس کے بعد یہ اپنی نیچے کی طرف حرکت دوبارہ شروع کر سکتا ہے،

Dimitrios Zappas 15:42 2025-08-12 UTC+2

اگست 11 2025 کو جی بی پی / یو ایس ڈی کی پیشن گوئی

گھنٹہ وار چارٹ پر، جمعہ کے روز جی بی پی / یو ایس ڈی نے 1.3425 کی سطح سے دو ریباؤنڈز بنائے، اور پیر کو 1.3470 پر 76.4% ریٹریسمنٹ لیول

Samir Klishi 19:29 2025-08-11 UTC+2

اگست 11 2025 کو یورو / یو ایس ڈی کی پیشن گوئی

جمعہ کو، یورو / یو ایس ڈی نے 1.1637–1.1645 سپورٹ زون سے دو ریباؤنڈ کیے اور یورو کے حق میں ہو گئے۔ اس کا مطلب ہے کہ اوپر کی حرکت

Samir Klishi 19:24 2025-08-11 UTC+2

اگست 11-15 2025 کے لیے سونے (ایکس اے یو / یو ایس ڈی) کے لیے تجارتی اشارہ: $3,380 سے نیچے فروخت کریں یا 3,341 ریباؤنڈ ہونے پر خریدیں (21 ایس ایم اے - 7/8 مرے)

ایگل انڈیکیٹر ایک منفی اشارہ دکھا رہا ہے، لہذا اگر ہم خرید رہے ہیں تو ہمیں بہت محتاط رہنا چاہیے، کیونکہ آنے والے گھنٹوں اور پورے ہفتے میں مندی

Dimitrios Zappas 18:56 2025-08-11 UTC+2

اگست 11-15 2025 کے لیے یورو / یو ایس ڈی کے لیے تجارتی سگنل: 1.1650 سے نیچے فروخت کریں (200 ای ایم اے - 7/8 مرے)

اگر آنے والے دنوں میں یورو 1.1650 سے نیچے مضبوط ہو جاتا ہے، تو کسی بھی تکنیکی ریباؤنڈ کو فروخت جاری رکھنے کے موقع کے طور پر دیکھا جائے گا۔

Dimitrios Zappas 18:53 2025-08-11 UTC+2

اگست 8-11 2025 کے لیے بٹ کوائن کے لیے تجارتی سگنل: $117,800 سے نیچے فروخت کریں (200 ای ایم اے - 21 ایس ایم اے)

یہ کہ $115,000 سے نیچے کی کمی بیئرش سائیکل کو بحال کر سکتی ہے۔ لہذا، ہم توقع کرتے ہیں کہ بٹ کوائن 112,500 پر مرے کے 4/8 تک پہنچ جائے

Dimitrios Zappas 20:08 2025-08-10 UTC+2
ابھی فوری بات نہیں کرسکتے ؟
اپنا سوال پوچھیں بذریعہ چیٹ.
 

Dear visitor,

Your IP address shows that you are currently located in the USA. If you are a resident of the United States, you are prohibited from using the services of InstaFintech Group including online trading, online transfers, deposit/withdrawal of funds, etc.

If you think you are seeing this message by mistake and your location is not the US, kindly proceed to the website. Otherwise, you must leave the website in order to comply with government restrictions.

Why does your IP address show your location as the USA?

  • - you are using a VPN provided by a hosting company based in the United States;
  • - your IP does not have proper WHOIS records;
  • - an error occurred in the WHOIS geolocation database.

Please confirm whether you are a US resident or not by clicking the relevant button below. If you choose the wrong option, being a US resident, you will not be able to open an account with InstaTrade anyway.

We are sorry for any inconvenience caused by this message.