
یہ بھی دیکھیں


 05.11.2026 12:37 PM
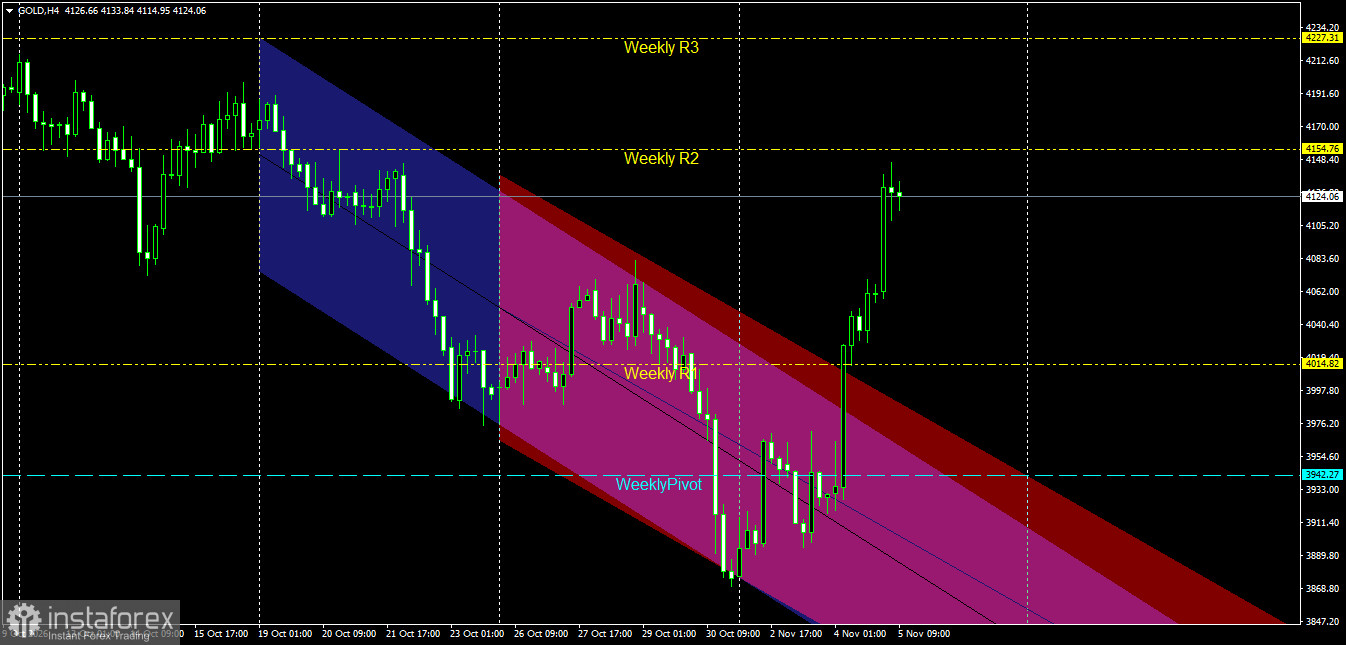
The four-hour (H4) chart for gold (GOLD, H4) reveals a significant technical development: the price has broken out of its downward corrective path and surged above the descending price channel, while simultaneously clearing key weekly pivot and resistance levels. This shift reflects a change in market sentiment, with the bulls regaining control over price action.
First: Technical Analysis of the Current Situation.
Descending Channel Breakout:
Gold had previously been trading within an extended descending price channel—marked in blue and purple—during which it established a local low near the 3868.80–3889.80 range.
Recent sessions have seen a strong, impulsive bullish move that successfully broke through the upper boundary of the descending channel and stabilized above it, effectively negating the previous bearish trend and paving the way for a new upward trajectory.
Weekly Pivot Points, Supports, and Resistances:
Weekly Pivot: Located at 3942.27. The price is currently trading comfortably above this level, which now serves as a primary support base in the event of any corrective pullback.
Weekly Resistance 1 (Weekly R1): Located at 4014.82. This level was breached with ease, driven by strong, impulsive candles, and has since transitioned into a near-term support zone. Weekly Resistance 2 (Weekly R2): Located at 4154.76; the price is currently approaching this level, trading near 4124.06.
Weekly Resistance 3 (Weekly R3): Situated at 4227.31 / 4234.20, this represents the primary target for the current bullish wave.
Current Price Action:
Gold is currently trading around the 4124.06 level following a rapid ascent from the 3933.00 area, effectively targeting the resistance zone at 4154.76 (Weekly R2).
Second: Expected Movement Scenarios:
Main Scenario (Continuation of the Bullish Trend):
Maintaining a position above the previously broken resistance level of 4014.82 supports continued upward momentum.
Should the price successfully break through the second weekly resistance (Weekly R2) at 4154.76 and stabilize above it—confirmed by a 4-hour candle—it is expected to continue rising toward the third weekly resistance (Weekly R3) at 4227.31, followed by previous highs near 4234.20.
Alternative Scenario (Temporary Bearish Correction):
If the price encounters significant rejection at the 4154.76 resistance level, it may enter a corrective retest phase, targeting the previously broken resistance level (Weekly R1) at 4014.82. The 4014.82 – 3942.27 range is considered a strong support zone where a resurgence of buying power is expected; the positive outlook on the chart would only be invalidated if the price breaks below the weekly pivot point of 3942.27 and sustains a position beneath it.
Price Action on the Daily Chart:
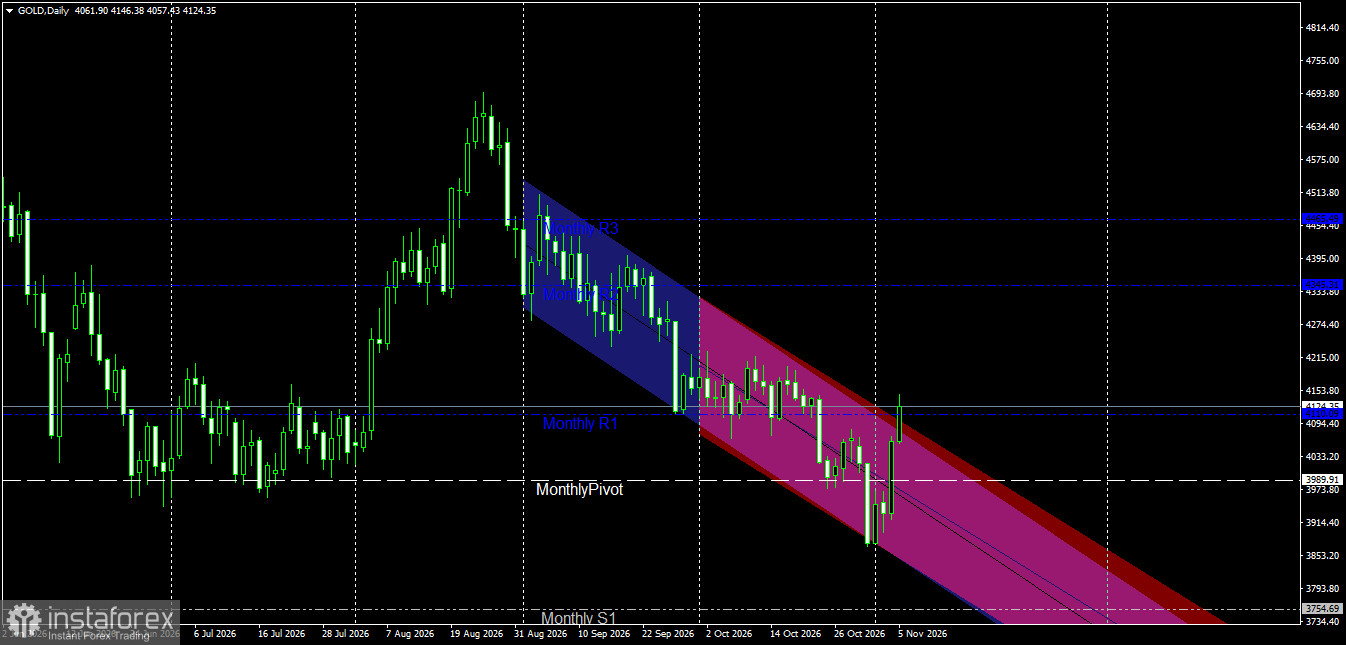
The price is currently trading at 4124.35, following a strong bullish rebound from the bottom of a descending price channel and support zones near 3850–3900.
The price has successfully broken above the upper boundary of the descending channel and the first monthly resistance level (Monthly R1) at 4110.09, moving past the bearish trend line.
Expected Movement:
Bullish Scenario: If the price stabilizes above the 4110.09 level (previously resistance, now support), the upward trend is likely to continue, targeting the next monthly resistance level at 4345.31 (Monthly R2).
Bearish (Corrective) Scenario: If the price fails to hold above the breakout zone and falls back below it, it may undergo a retest of the trend lines or the nearby support level, located around the monthly pivot point (Monthly Pivot) at 3989.91.


