
Veja também


 25.08.2026 08:08 AM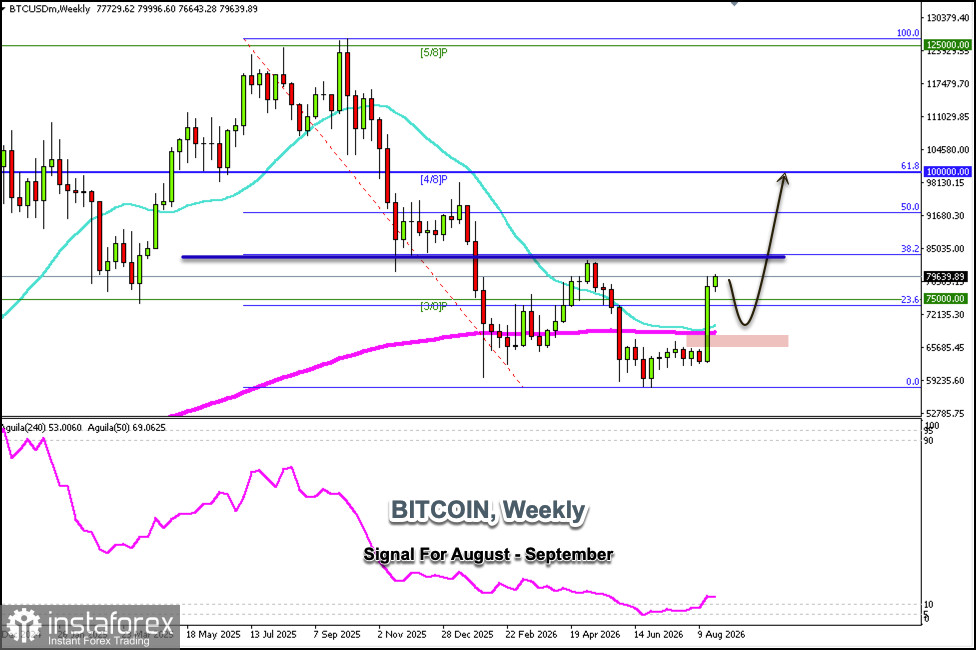
The weekly Bitcoin chart shows a strong uptrend, and it is likely to continue rising in the coming days until it reaches the 38.2% Fibonacci retracement level around $85,000.
On the daily chart, Bitcoin faces strong resistance around $81,250—a level representing the +2/8 Murray level—and is also technically overbought. Therefore, if the price reaches this level in the coming hours, it could be considered a signal to sell below this zone.
If the upward momentum prevails and Bitcoin breaks above $81,250, it is likely to continue rising until it reaches April's high around $85,000.
Our outlook remains bullish, but we must be very cautious, as a technical correction is expected below $81,250 in the coming weeks. If Bitcoin remains below this level, we can sell with targets at the 3/8 Murray level around $75,000 and ultimately expect it to reach the 200 EMA, which coincides with the 21 SMA around $66,500.
Bitcoin is expected to hover between $81,250 and $75,000 over the next few days; this will be a good range for buying and selling while awaiting consolidation.
You have already liked this post today
*A análise de mercado aqui postada destina-se a aumentar o seu conhecimento, mas não dar instruções para fazer uma negociação.


