Veja também

 30.12.2025 04:46 AM
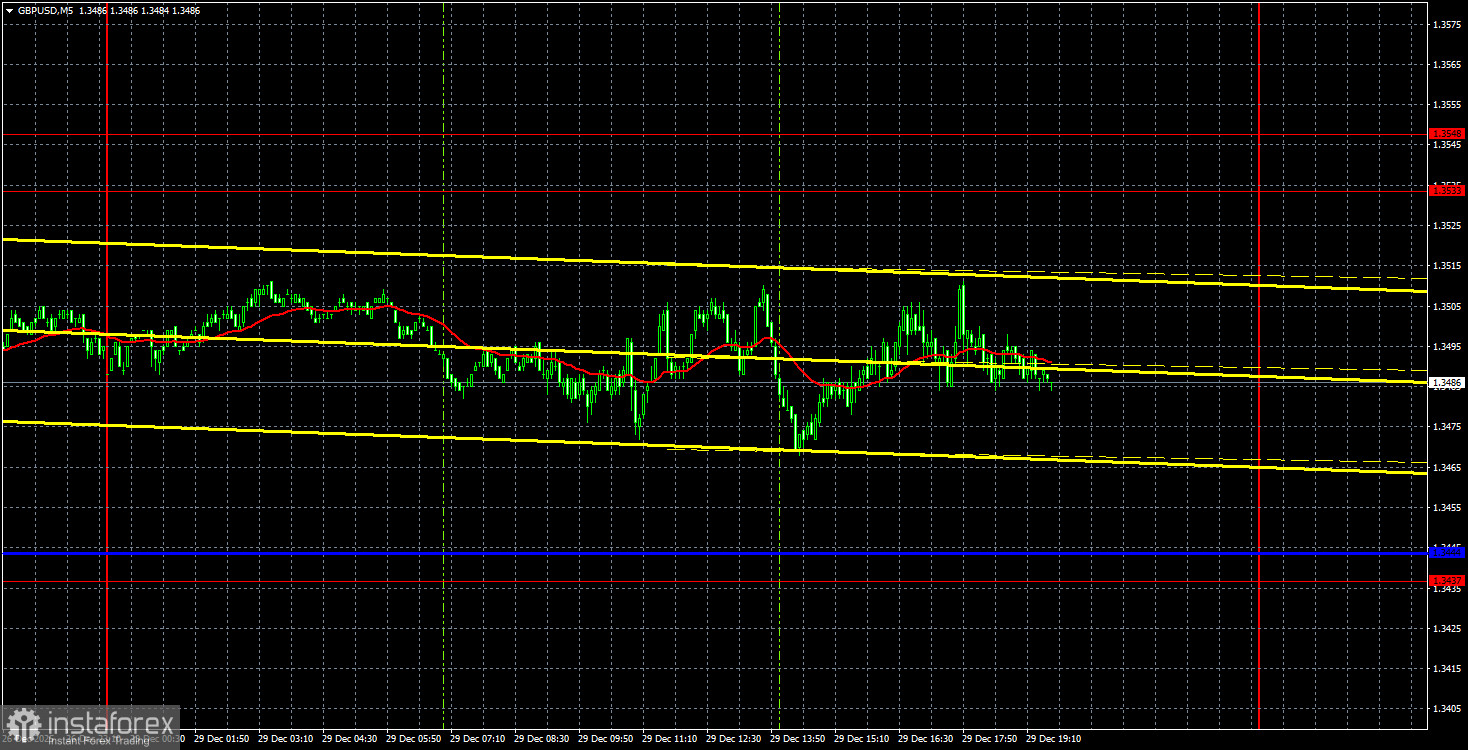
The GBP/USD currency pair continued to trade with minimal volatility on Monday, with no significant macroeconomic or fundamental background. As a result, traders had neither the basis nor the desire to open trading positions. The technical picture has not changed, and there are no news items to analyze.
An upward trend persists on the hourly timeframe, along with a relevant ascending trendline. Thus, technically, the pound's upward movement can resume at any moment. However, it is unlikely to resume this week due to the empty event calendar and ongoing New Year celebrations worldwide. Nevertheless, the pair's medium-term outlook is clear. This does not mean that the British currency will appreciate throughout January. However, we have already discussed the overall fundamental picture many times. Thus, we expect only declines in the US dollar in 2026.
On the 5-minute timeframe, no trading signals were formed on Monday. The price failed to engage with either the critical line or the 1.3533-1.3548 area during the day. The day's overall volatility was 45 pips.
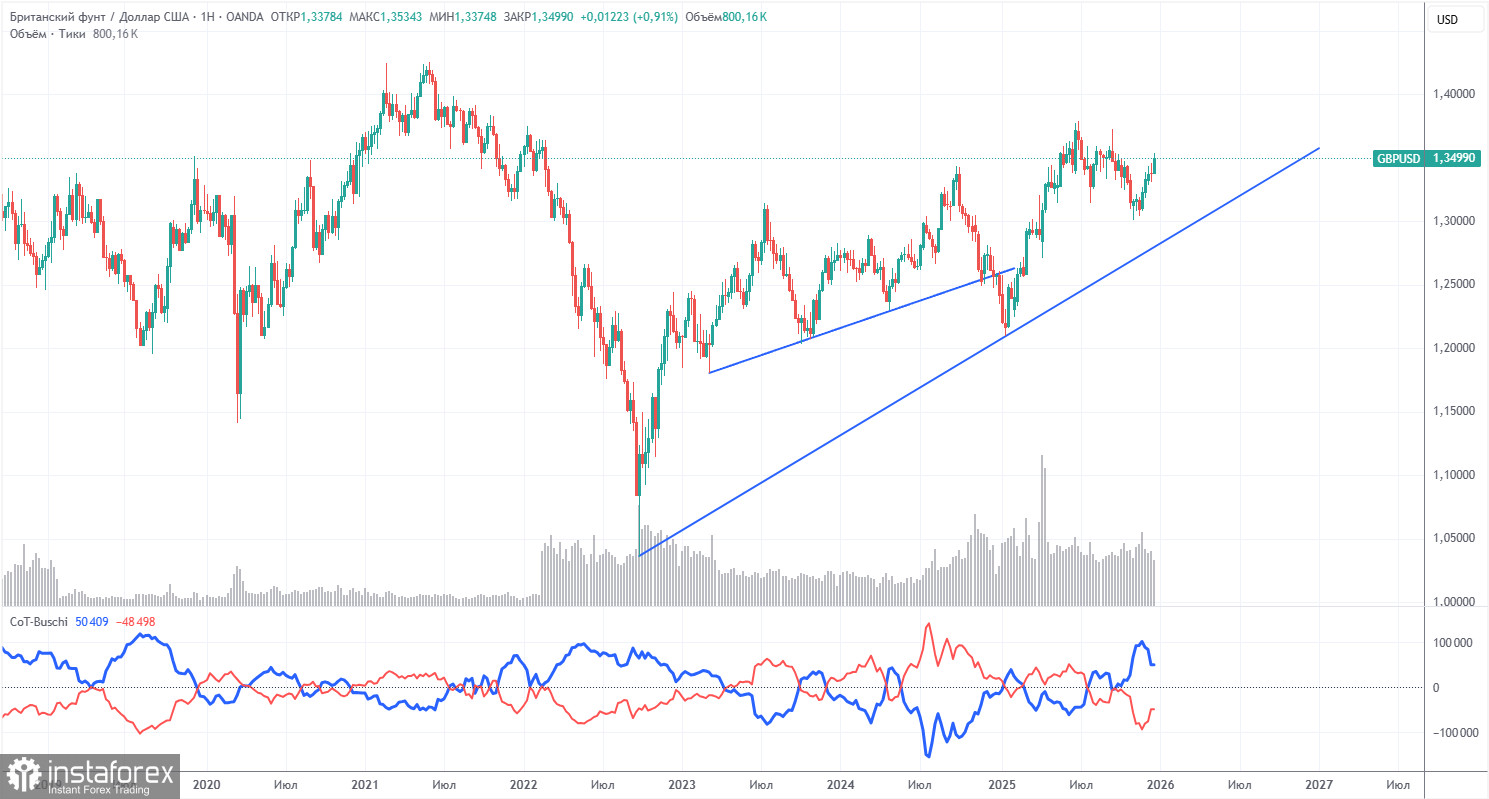
COT reports for the British pound indicate that sentiment among commercial traders has fluctuated sharply in recent years. The red and blue lines, reflecting the net positions of commercial and non-commercial traders, routinely cross each other and are, in most cases, close to the zero mark. Currently, the lines are pulling apart, but non-commercial traders are dominating with their sell positions. Speculators are increasingly selling the pound, but, as mentioned, it does not matter how low the demand for the British currency is; it is often even lower for the US dollar.
The dollar continues to decline due to Donald Trump's policies, as evident on the weekly timeframe (see illustration above). The trade war will continue in one form or another for a long time. The Federal Reserve will reduce its rate regardless in the next 12 months. Demand for the dollar will, in any case, fall. According to the latest COT report (dated December 16) for the British pound, the "Non-commercial" group opened 1,600 BUY contracts and closed 25,400 SELL contracts. Thus, the net position of non-commercial traders increased by 27,000 contracts over the week.
In 2025, the pound appreciated significantly, but it should be understood that the reason is one: Trump's policy. Once this reason is mitigated, the dollar may start to rise, but nobody knows when.

On the hourly timeframe, the GBP/USD pair continues to form a new upward trend, but the market is currently in a holiday pause. We believe the pound sterling will continue to grow in the medium term, regardless of the local macroeconomic and fundamental backdrop. The upward trend for the pound remains consistent across almost all timeframes.
For December 30, we highlight the following important levels: 1.2863, 1.2981-1.2987, 1.3042-1.3050, 1.3096-1.3115, 1.3201-1.3212, 1.3307, 1.3369-1.3377, 1.3437, 1.3533-1.3548, and 1.3584. The Senkou Span B line (1.3421) and the Kijun-sen line (1.3474) may also serve as sources of signals. It is recommended to set the Stop Loss order to breakeven when the price moves in the desired direction by 20 pips. The Ichimoku indicator lines may move throughout the day, which should be taken into account when determining trading signals.
On Tuesday, there are no important events or reports planned in the UK or the US. The upward movement may continue, but new buy signals are necessary. Flat conditions and low volatility are more likely today.
Today, traders may consider selling if the price consolidates below the critical line with a target of 1.3437. Long positions will become relevant if the price rebounds from the Kijun-sen line with a target of 1.3533-1.3548.


