Veja também

 08.05.2026 11:22 AM
Will $100?per?barrel oil become the new normal? While equity indices fell in March in response to the Brent and WTI rally, markets adapted in April and have since charged higher toward record levels. Energy costs are elevated, but revenues are higher still. According to FactSet, 85% of companies that have reported Q1 results beat earnings expectations. The market will find a way to live with high oil prices.
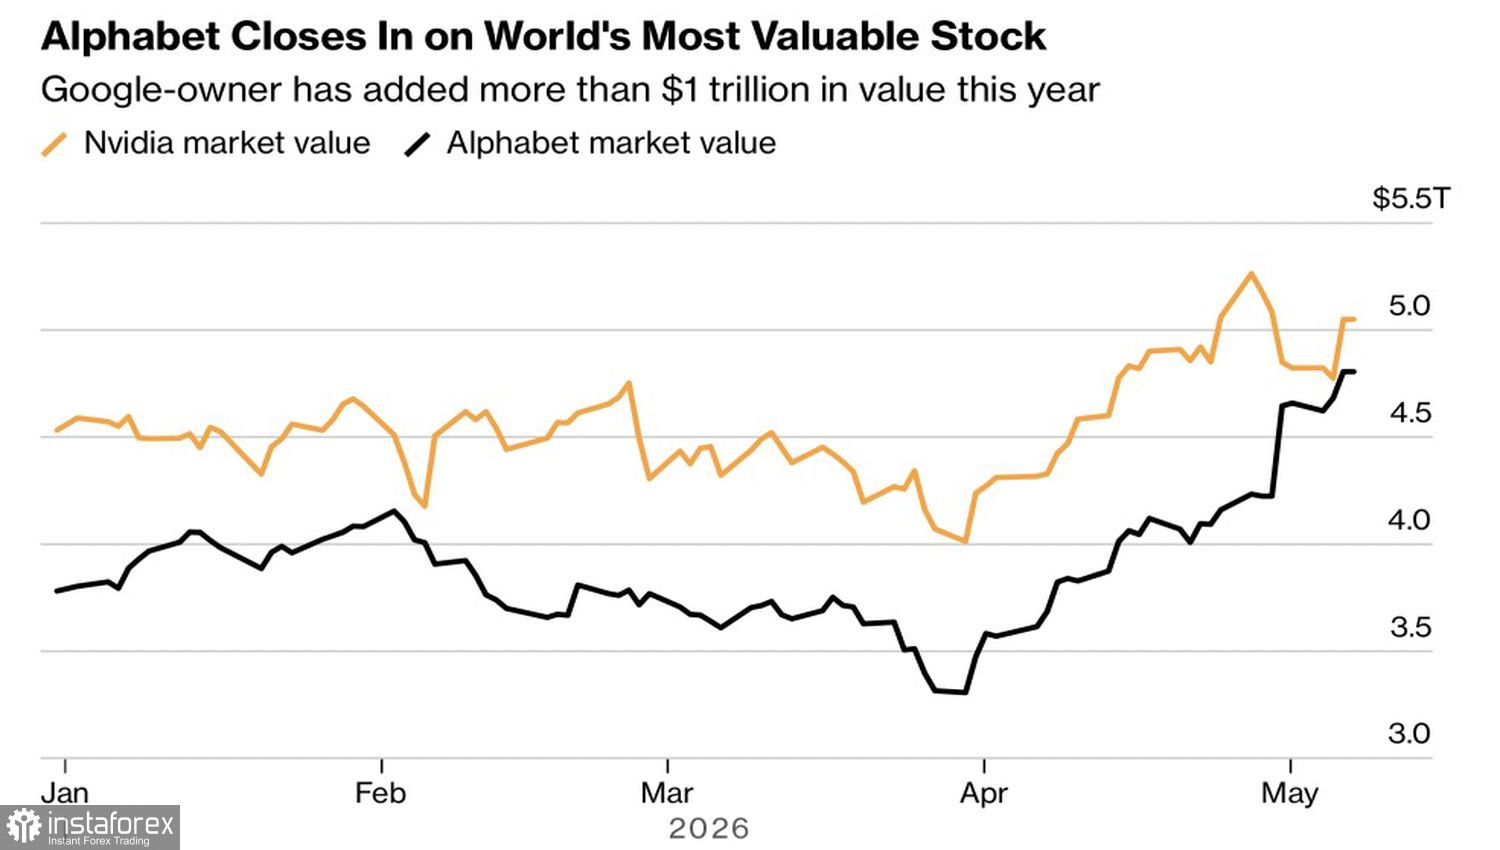
Investors quickly tired of geopolitics and piled into technology stocks. Alphabet is especially popular — its market cap is now approaching that of market leader NVIDIA.
Market capitalizations of the world's largest companies
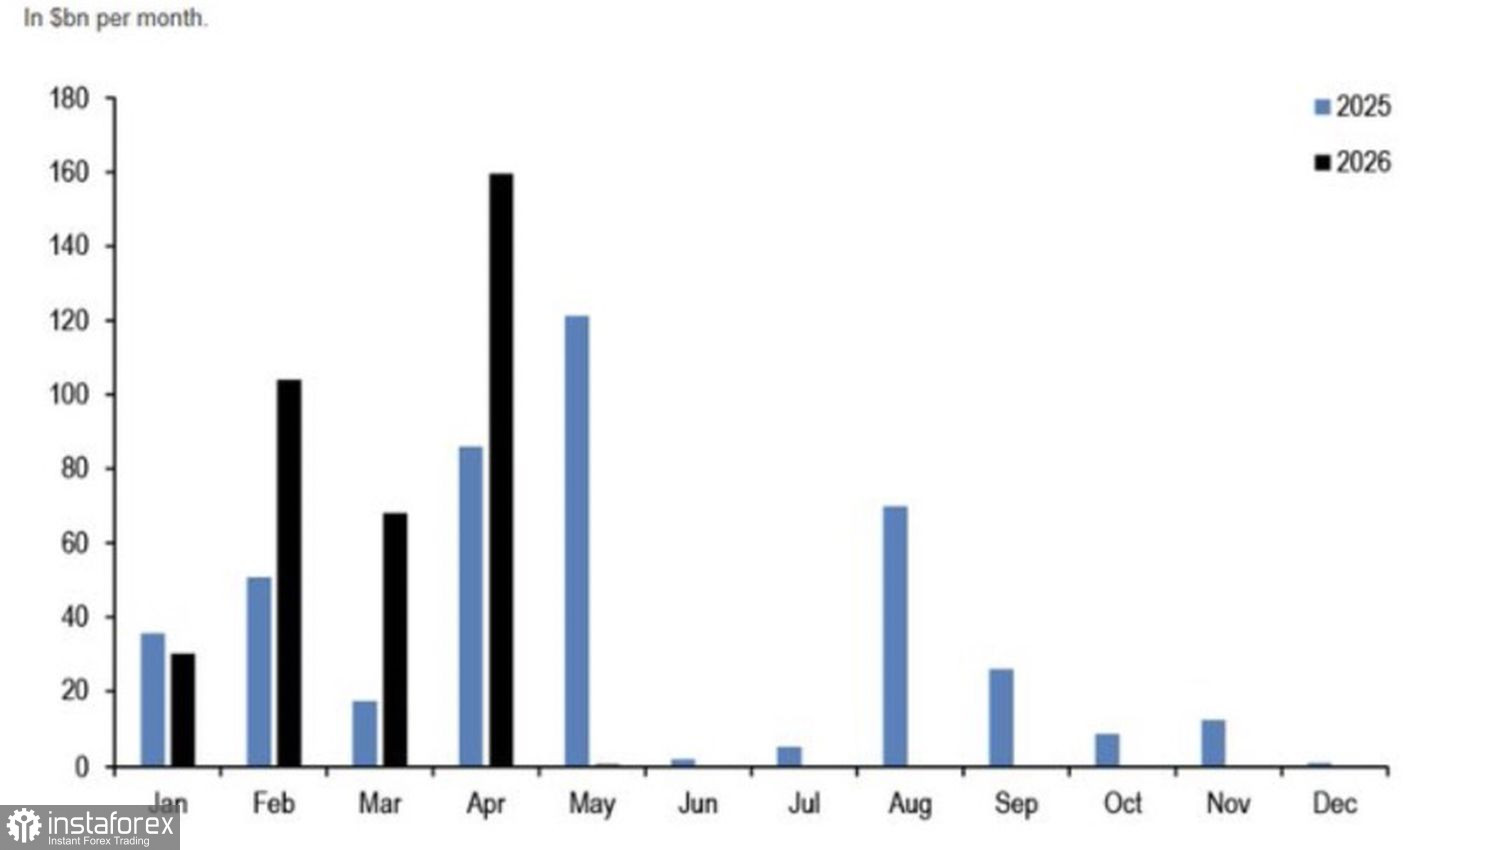
JP Morgan argues that, besides attractive fundamentals and blockbuster profits, another structural factor is fueling broad tech buying: share buybacks. Repurchase activity now exceeds last year's levels, which is a bullish impulse for equities.
The S&P 500's retreat from record highs was triggered by a resumption of hostilities. Iran retaliated against the US after a tanker was not allowed to leave the Strait of Hormuz. Washington responded with strikes on the sites that launched the rockets. Investors got nervous, although the White House did not classify the incident as a ceasefire violation. US President Donald Trump called Tehran's action a joke and said Washington quickly put it in its place.
Share?buyback activity by tech companies
The administration's reluctance to acknowledge an obvious ceasefire breach by Iran suggests the peak of combat may already be behind us. The conflict is likely to be resolved diplomatically, though flare?ups of geopolitical tension remain possible — all else equal, good for risk assets and the S&P 500.
The S&P's rapid rally pushed Bloomberg's model into so?called "manic" territory: high?yield corporate spreads, volatility, and pairwise correlations are flashing warning signs. That, by itself, does not mean that the S&P 500 must enter a correction. Historically, when similar signals appeared (2012–2023), the S&P tended to outperform the small?cap Russell 2000.
The pullback from record highs may simply reflect profit?taking ahead of the April US nonfarm payrolls release. Ironically, weak payrolls could be bullish for the broad index — they would raise the odds of a Fed rate cut in 2026.
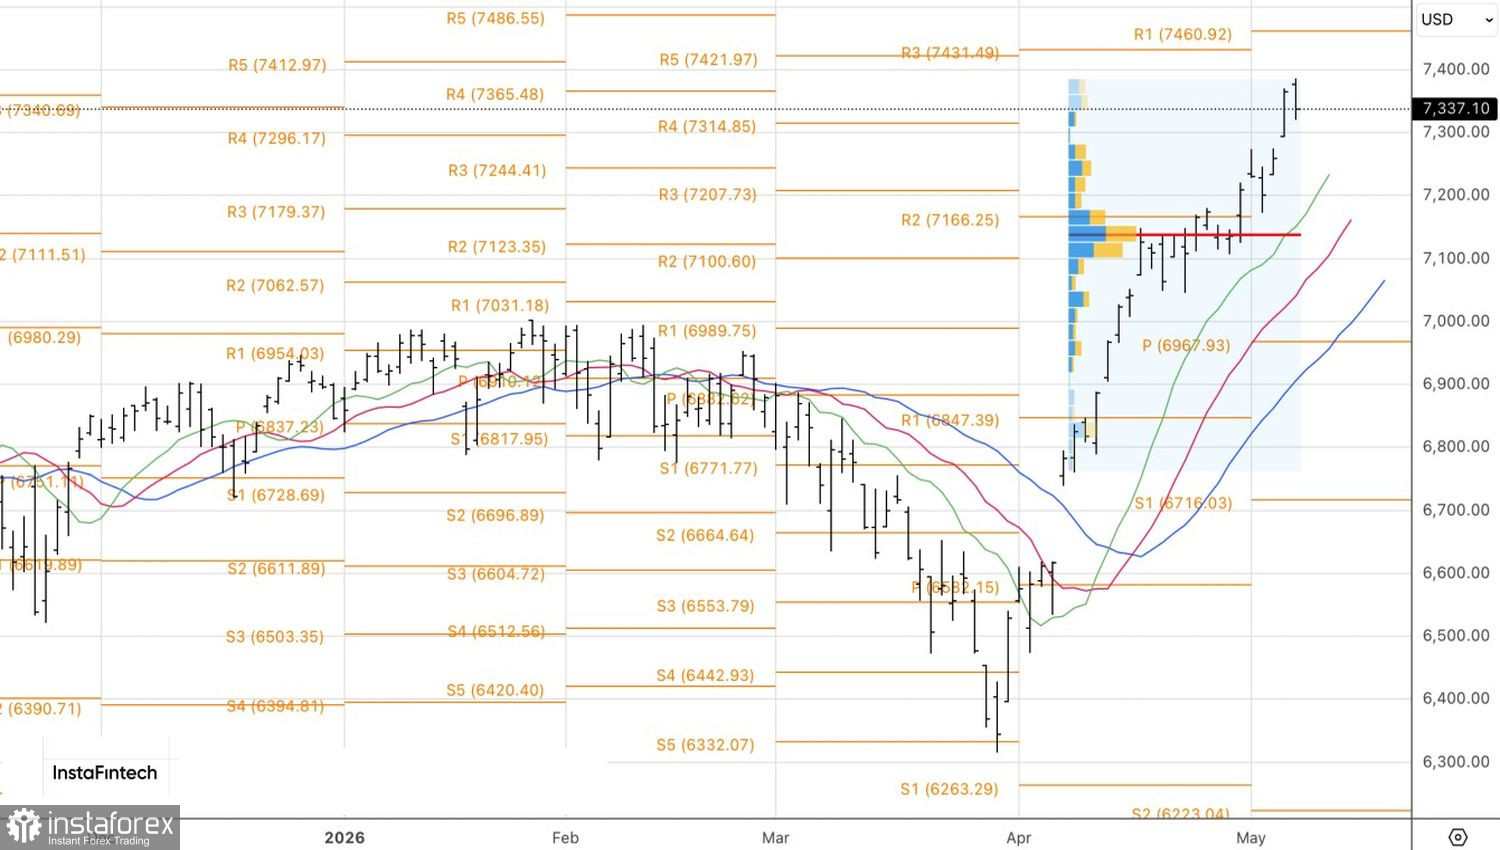
Technically, the daily chart shows a retreat from record highs, but the overall bias remains bullish. As long as the S&P 500 trades above fair value at $7,135, the tactical emphasis should remain on buying pullbacks.


