
Veja também


 03.11.2026 06:36 AM
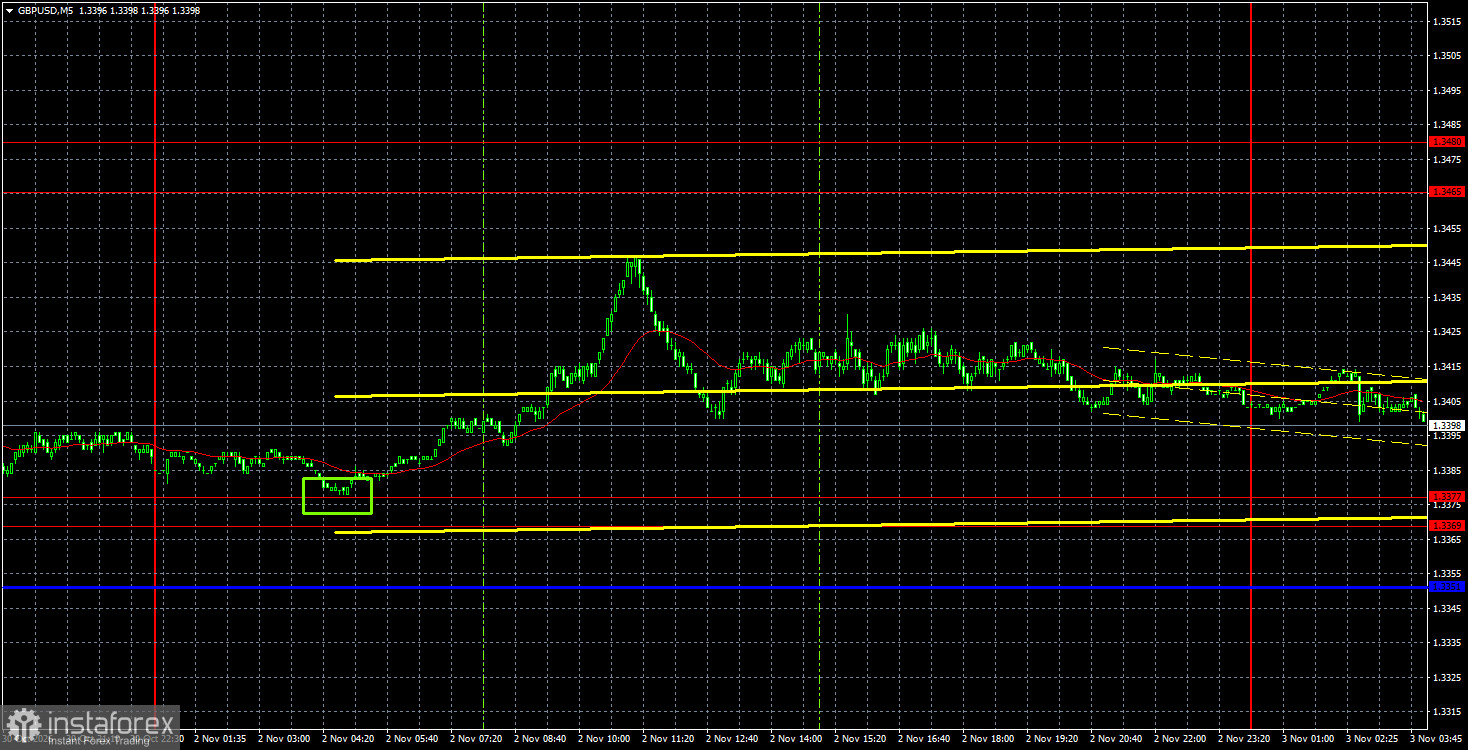
The GBP/USD currency pair moved a little higher on Monday. Toward the end of the day, it pulled back, but the overall uptrend remains intact. We believe the British currency has every reason to continue its bullish impulse this week. First, congressional election results in the US are likely to favor the Democrats. This means that over the next two years Congress will be more occupied with partisan warfare than with addressing state issues and problems. Donald Trump already intends to veto almost any Democratic proposal, and the Democrats will very likely respond in kind. Therefore, next year Trump may start a new war—inside Congress. It will be especially interesting to watch if the Republicans lose both chambers. Thus, the US dollar is unlikely to receive support from the elections. Second, the Bank of England may announce the first rate hike of the current cycle as soon as Thursday, which should also support the pound. Because traders do not ignore factors favoring the British currency in the GBP/USD pair, a natural market reaction to these events is expected. On Friday, US unemployment and labor-market reports will be released, and they are unlikely to bring positive surprises.
Technically, the pound continues to form an uptrend. The pound has not fallen below the Senkou Span B line, so the bullish tendency remains valid. The 1.3369–1.3377 area also acts as support for the pound. We believe the pound has every chance and basis to continue moving upward.
On the 5-minute timeframe, one buy signal was generated on Monday in the 1.3369–1.3377 area. This signal formed during the Asian session, but traders could have opened long positions at the start of the European session. During the day, sterling gained at least 20 pips.
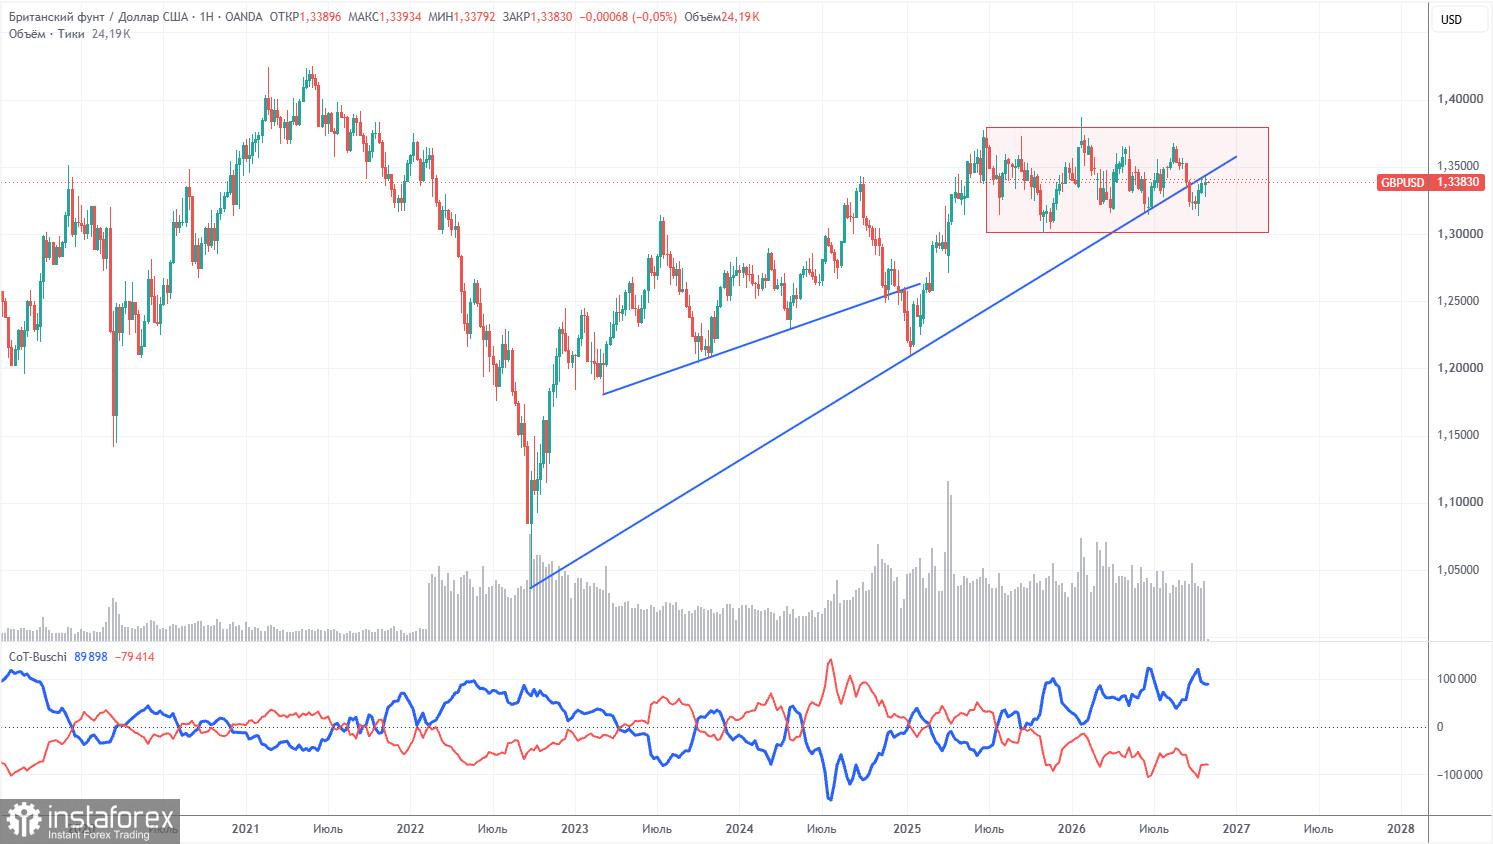
COT reports for the pound show non-commercial traders have dominated the market with short positions for several months now. The net position is negative despite the persistent long-term uptrend. Given events in the Middle East, it is unsurprising that dollar demand has been relatively strong in 2026. The U.S.–Iran war is formally paused but could resume soon. The Federal Reserve's changed monetary stance also supports the dollar, and the dollar's ascending trend line was breached—though amid a flat—so we do not regard the uptrend as over.
Over the long term, the dollar continues to weaken under U.S. policy trends, as visible on the weekly timeframe. Trade tensions will continue in one form or another, and policy is generally directed toward dollar weakening. According to the latest COT report (dated October 27), the "Non-commercial" group opened 2,400 BUY contracts and closed 1,400 SELL contracts. Thus, the net position of non-commercial traders rose by 1,000 contracts over the week.
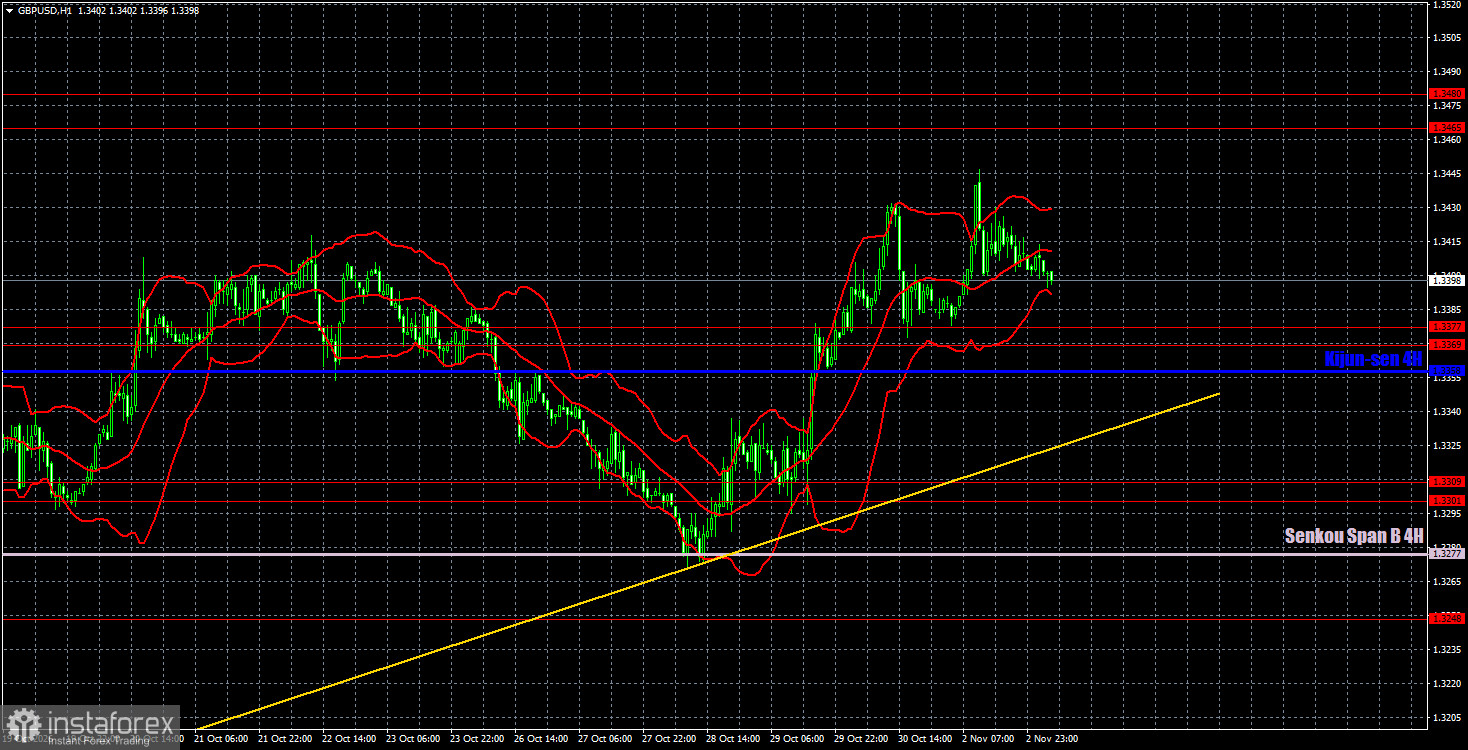
On the hourly timeframe, GBP/USD continues to form a logical, orderly uptrend. On the daily and weekly timeframes, the price cleared liquidity from recent lows and remained inside sideways channels. Thus, one can expect the British currency to rise at least to 1.3650, the upper boundary of the sideways channel on the daily chart. Reasons for the pound's rise are not needed, just as reasons were not needed for the dollar's rise in the past one and a half to two months.
For November 3 we highlight the following important levels: 1.3042–1.3050, 1.3096–1.3115, 1.3179–1.3187, 1.3248, 1.3301–1.3309, 1.3369–1.3377, 1.3465–1.3480, 1.3588, 1.3671–1.3681. The Ichimoku Senkou Span B (1.3277) and Kijun-sen (1.3358) lines can also generate signals. It is recommended to move the Stop Loss to breakeven when the price moves 20 pips in the correct direction. The Ichimoku indicator lines may shift during the day, which you should take into account when determining trade signals.
Today, no important events or releases are scheduled in the UK, while the US will publish the JOLTS job openings report. We do not consider this report important or timely, so we do not expect the market to react to it. Most likely, traders will prefer to wait for the US election results today.
Traders can consider the 1.3301–1.3309 area as a target for short positions if the price consolidates below the 1.3369–1.3377 area. A bounce from the 1.3369–1.3377 area would allow you to reconsider the 1.3465–1.3480 area as a target for long positions.


