empty
13.02.2025 01:48 PM
USD/JPY: Simple Trading Tips for Beginner Traders on February 13th (U.S. Session)

Trade Analysis and Trading Advice for the Japanese Yen

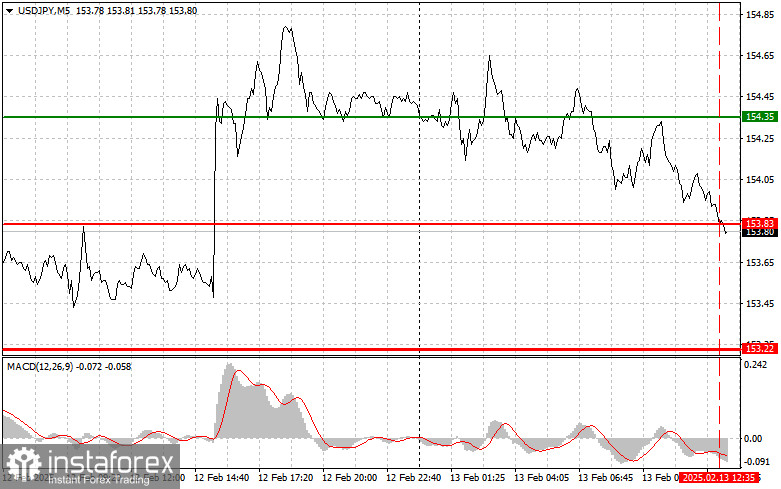
The test of 153.83 in the morning session occurred when the MACD indicator had already moved significantly below the zero mark, limiting further downward potential for the pair. Because of this, I did not sell the dollar.

Today, we expect Producer Price Index (PPI) data along with core PPI figures, which could restore demand for the U.S. dollar, supporting yesterday's bullish market.

The key factor will be how actual data compares to forecasts. Stronger-than-expected data will increase the likelihood of a more hawkish Fed, pushing U.S. bond yields higher and making the dollar more attractive to investors. Yesterday's USD rally on CPI data is proof of this trend. Weaker-than-expected data could pressure the dollar, potentially reversing yesterday's gains.

The weekly initial jobless claims report is unlikely to have a significant impact on the market.

For today's intraday strategy, I will focus on executing Scenarios #1 and #2.

This image is no longer relevant

Buy Signal

Scenario #1: I plan to buy USD/JPY if the price reaches 154.04 (green line on the chart), aiming for a rise to 154.75 (thicker green line on the chart). At 154.75, I will exit buy trades and open short positions in the opposite direction, expecting a 30-35 point pullback.

Important: Before buying, ensure the MACD indicator is above the zero mark and just starting to rise.

Scenario #2: I also plan to buy USD/JPY if there are two consecutive tests of 153.63, while the MACD is in the oversold zone. This will limit the pair's downward potential and may trigger a market reversal. Targets: 154.04, 154.75

Sell Signal

Scenario #1: Selling USD/JPY is possible after the price breaks below 153.63 (red line on the chart), leading to a sharp decline. The key target for sellers will be 153.03, where I will exit short trades and buy in the opposite direction, expecting a 20-25 point retracement.

Important: Before selling, ensure the MACD indicator is below the zero mark and just starting to decline.

Scenario #2: I also plan to sell USD/JPY if there are two consecutive tests of 154.04, while the MACD is in the overbought zone. This setup will limit the pair's upward potential and may lead to a market reversal downward. Targets: 153.63, 153.03
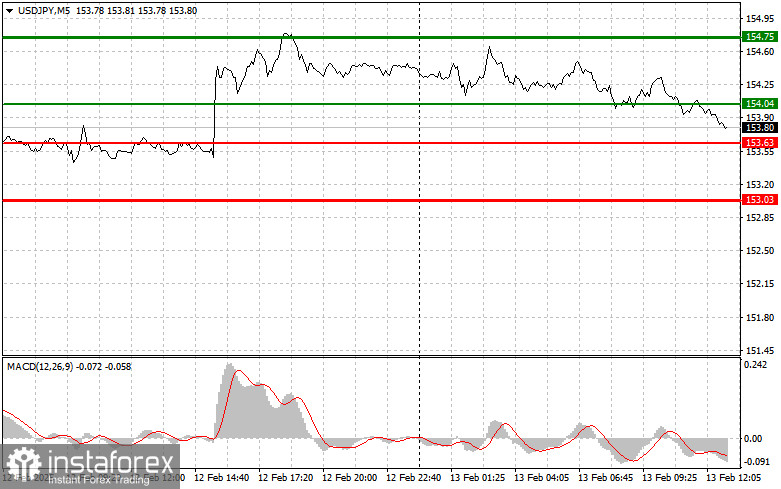
This image is no longer relevant

Key Chart Levels:

  • Thin Green Line – Entry price for buy trades
  • Thick Green Line – Expected Take Profit level for long trades
  • Thin Red Line – Entry price for sell trades
  • Thick Red Line – Expected Take Profit level for short trades
  • MACD Indicator: When entering the market, traders should monitor overbought and oversold zones.

Important Notes for Beginner Traders:

Exercise Caution – Avoid opening new trades before major economic reports to prevent sudden price fluctuations.

Use Stop-Loss Orders – If you trade during high-impact news releases, always set stop-loss orders to minimize potential losses. Without stop-losses, you risk rapid account depletion, especially if money management is not followed or if large lot sizes are used.

Follow a Structured Trading Plan – Spontaneous trading decisions based on current market conditions are a losing strategy for intraday traders. A clear trading plan, like the one outlined above, is essential for consistent success.

Recommended Stories

EUR/USD: plan para la sesión europea del 5 de agosto. Informes Commitment of Traders COT (análisis de las operaciones de ayer). El euro permanece en el canal

Ayer se formó solo un punto de entrada al mercado. Veamos el gráfico de 5 minutos y analicemos lo que ocurrió allí. En mi pronóstico matutino presté atención al nivel

Miroslaw Bawulski 08:36 2025-08-05 UTC+2

Petróleo. ¿El mercado mantendrá el soporte o las tendencias perforadas se convertirán en una trampa para los alcistas?

Desde principios de semana, el mercado del petróleo se mantiene en un equilibrio tenso. El Brent, que perdió su tendencia alcista de mayo, solo logró recuperar parcialmente la caída: tras

Anna Zotova 14:35 2025-07-24 UTC+2

GBP/USD: plan para la sesión europea del 22 de julio. Informes COT (análisis de las operaciones de ayer). La libra se fortaleció bastante bien

Ayer se formaron varios puntos de entrada al mercado. Vamos a mirar el gráfico de 5 minutos y analizar lo que ocurrió. En mi pronóstico de la mañana presté atención

Miroslaw Bawulski 07:51 2025-07-22 UTC+2

Petróleo. Compresión hacia la resistencia y exportación forzada de petróleo desde Irán: señales preocupantes

Los futuros del petróleo Brent se acercaron a la zona de resistencia descendente, pero no lograron consolidarse por encima, retrocediendo hacia abajo. El panorama técnico sigue siendo tenso: el precio

Anna Zotova 13:20 2025-06-20 UTC+2

OPEP+ golpea al esquisto, el Brent pierde apoyo

Los futuros del crudo Brent vuelven a estar bajo presión: el precio no logró mantenerse por encima de la zona clave de $65,5 por barril y entró en una fase

Anna Zotova 14:04 2025-05-22 UTC+2

El Gas en un triángulo, el petróleo listo para saltar. La geopolítica vuelve a dictar las reglas del juego

El petróleo respira cambios. La política y la economía vuelven a entrelazarse en un nudo apretado, y los activos de materias primas —especialmente el petróleo y el gas— se convierten

Anna Zotova 11:21 2025-03-25 UTC+2

¿Crecimiento falso o nueva tendencia? Análisis de señales técnicas y fundamentales para el petróleo y el gas

Los futuros del petróleo Brent subieron a aproximadamente $71,3 por barril el martes, marcando la tercera sesión consecutiva de crecimiento, ya que la tensión en Medio Oriente eclipsó otros acontecimientos

Anna Zotova 10:58 2025-03-18 UTC+2

El S&P 500 asalta la cima. Informes sólidos y desregulación como detonantes del optimismo del mercado

El mercado bursátil vuelve a subir, con el S&P 500 en la cúspide de la euforia. ¿Qué será lo próximo? ¿Los aranceles y la política de la Reserva Federal reforzarán

Anna Zotova 10:18 2025-01-24 UTC+2

El S&P 500 está en la cima de la ola. Han aparecido síntomas de un mercado bajista

El jueves, los futuros de las acciones estadounidenses permanecen prácticamente sin cambios después de un impresionante rally en la sesión de trading anterior, cuando el S&P 500 alcanzó máximos históricos

Anna Zotova 09:58 2025-01-23 UTC+2

S&P 500. Sesgo alcista. El mercado sube con la vista puesta en Trump

Los futuros de las acciones estadounidenses registran ganancias el miércoles, tras el sólido repunte de la víspera. El martes, el índice S&P 500 subió un 0,88% y el Nasdaq sumó

Anna Zotova 10:28 2025-01-22 UTC+2
¿No puede hablar ahora mismo?
Ingrese su pregunta en el chat.
 

Dear visitor,

Your IP address shows that you are currently located in the USA. If you are a resident of the United States, you are prohibited from using the services of InstaFintech Group including online trading, online transfers, deposit/withdrawal of funds, etc.

If you think you are seeing this message by mistake and your location is not the US, kindly proceed to the website. Otherwise, you must leave the website in order to comply with government restrictions.

Why does your IP address show your location as the USA?

  • - you are using a VPN provided by a hosting company based in the United States;
  • - your IP does not have proper WHOIS records;
  • - an error occurred in the WHOIS geolocation database.

Please confirm whether you are a US resident or not by clicking the relevant button below. If you choose the wrong option, being a US resident, you will not be able to open an account with InstaTrade anyway.

We are sorry for any inconvenience caused by this message.