empty
25.03.2025 07:13 PM
EUR/USD: Trading Plan for the U.S. Session on March 25th (Review of Morning Trades)
In my morning forecast, I highlighted the 1.0779 level and planned to make trading decisions based on it. Let's look at the 5-minute chart and examine what happened there. The decline and formation of a false breakout at that level provided a good entry point, resulting in a rise of over 40 points. The technical picture has not changed for the second half of the day.

This image is no longer relevant

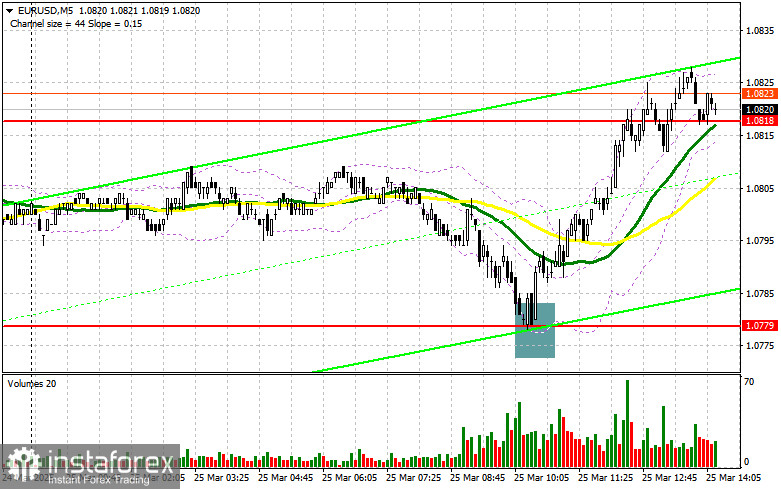
To open long positions on EURUSD:

Clearly, decent IFO data from Germany helped revive demand for the euro and halted the downward correction in the EUR/USD pair. However, everything could change in the second half of the day as we await important U.S. data. Strong figures for consumer confidence and new home sales in the U.S. will likely support the dollar, leading to a decline in the pair. Otherwise, EUR/USD could continue rising. If the data is ignored, focus will shift to the speech by FOMC member John Williams.

In the event of a decline, only a false breakout around the 1.0780 support area would signal new EUR/USD purchases in anticipation of building a bullish market with a target of retesting 1.0818, which is where the pair is trading now. A breakout and retest of this range will confirm a proper buy entry with a target of 1.0856. The furthest target will be 1.0892, where I plan to take profit.

If EUR/USD declines and shows no activity around 1.0780—which is more likely—the pair may continue correcting. In this case, sellers could drag it down to 1.0746. Only after a false breakout there will I consider buying the euro. I plan to open long positions from 1.0715 on a rebound, targeting a 30–35 point intraday correction.

To open short positions on EURUSD:

Sellers showed up around 1.0818, but a full-fledged move down hasn't occurred yet. If we don't see any reaction after the data release either, it's better to delay short positions until a test of 1.0856. Only a false breakout there will allow entry into short positions targeting a correction to 1.0818, where the moving averages are also located. A breakout and consolidation below this area would offer another valid selling opportunity with a move toward 1.0780. The furthest target will be 1.0746, where I plan to take profit.

If EUR/USD rises in the second half of the day and sellers fail to act around 1.0856, buyers may push the pair higher. In that case, I'll postpone short positions until a test of the next resistance at 1.0892. I will sell from there only after a failed consolidation. If there's no downward movement from that level either, I'll consider short positions from 1.0923 on a rebound, targeting a 30–35 point downward correction.

This image is no longer relevant

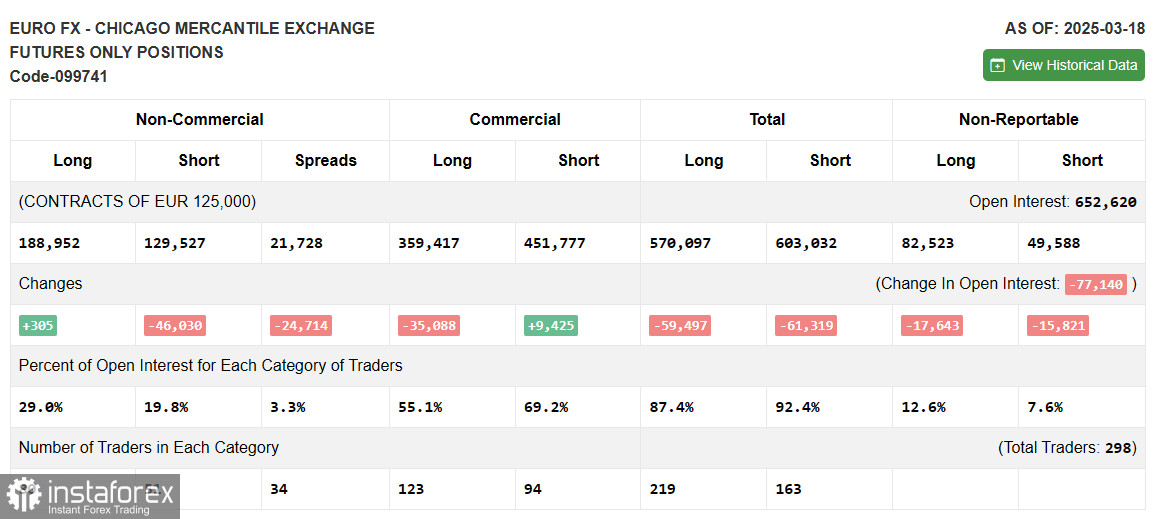
COT Report (Commitment of Traders) as of March 18:

The report showed an increase in long positions and a significant reduction in shorts. More and more traders are willing to buy the euro, while sellers are continuing to exit the market. The ECB's cautious approach to cutting interest rates and weak U.S. data, which is forcing the Federal Reserve to adopt a more dovish stance, are reasons behind a major shift in market dynamics.

The COT report indicates that non-commercial long positions rose by 305 to 188,952, while short positions dropped by 46,030 to 129,527. As a result, the net gap between long and short positions decreased by 24,714.

This image is no longer relevant

Indicator Signals:

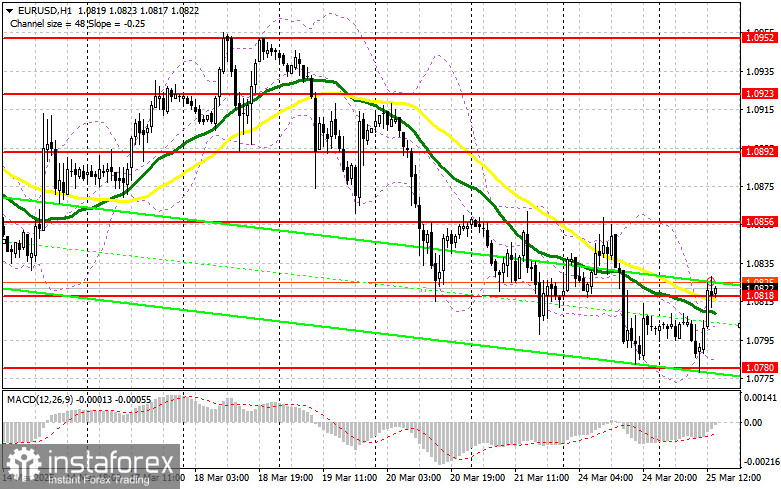
Moving Averages: Trading is occurring around the 30- and 50-day moving averages, indicating a sideways market.

Note: The periods and prices of moving averages are considered on the H1 hourly chart by the author and may differ from the standard definitions on the D1 daily chart.

Bollinger Bands: In case of a decline, the lower band of the indicator near 1.0780 will act as support.

Indicator Descriptions:

  • Moving Average (MA): Identifies the current trend by smoothing volatility and noise. Period – 50 (yellow on the chart); Period – 30 (green on the chart).
  • MACD (Moving Average Convergence/Divergence): Fast EMA – period 12; Slow EMA – period 26; Signal SMA – period 9.
  • Bollinger Bands: Period – 20.
  • Non-commercial traders: Speculators such as individual traders, hedge funds, and large institutions using the futures market for speculative purposes.
  • Non-commercial long positions: The total open long positions held by non-commercial traders.
  • Non-commercial short positions: The total open short positions held by non-commercial traders.
  • Net non-commercial position: The difference between short and long non-commercial positions.

Recommended Stories

Recomendaciones para operar y análisis de transacciones con el par GBP/USD para el 11 de agosto. La libra se mantiene en calma, pero no cede posiciones.

El par de divisas GBP/USD durante el viernes tampoco mostró ningún movimiento interesante. Sin embargo, tampoco comenzó la corrección; la libra mantuvo las posiciones ganadas y conserva una tendencia alcista

Paolo Greco 04:31 2025-08-11 UTC+2

Recomendaciones para operar y análisis de transacciones con el par EUR/USD para el 11 de agosto. Flat y tres señales excelentes.

El par de divisas EUR/USD durante el viernes se negoció exclusivamente de forma lateral. El trasfondo macroeconómico ese día estuvo ausente, y los traders decidieron salir de fin de semana

Paolo Greco 04:31 2025-08-11 UTC+2

Recomendaciones para operar y análisis de las operaciones con el par GBP/USD el 7 de agosto. La libra ha recobrado el ánimo.

El par de divisas GBP/USD durante el miércoles también reanudó su movimiento ascendente, gracias a Donald Trump. Recordemos que ayer Trump impuso aranceles del 25% contra India, pero anteriormente

Paolo Greco 04:24 2025-08-07 UTC+2

Recomendaciones para operar y análisis de las operaciones con el par EUR/USD el 7 de agosto. Trump vuelve a hundir al dólar.

El par de divisas EUR/USD durante el miércoles reanudó su movimiento ascendente. El contexto macroeconómico ayer estuvo ausente tanto en la Eurozona como en EE.UU., a excepción de un informe

Paolo Greco 04:24 2025-08-07 UTC+2

Cómo operar el par EUR/USD el 6 de agosto. Consejos sencillos y análisis de operaciones para principiantes

Análisis de las operaciones del martes: Gráfico de 1H del par EUR/USD. El par de divisas EUR/USD continuó moviéndose el martes con una volatilidad mínima y exclusivamente en dirección lateral

Paolo Greco 06:35 2025-08-06 UTC+2

GBP/USD: plan para la sesión europea del 5 de agosto. Informes Commitment of Traders COT (análisis de las operaciones de ayer). Los compradores de la libra muestran cada vez más actividad

GBP/USD: plan para la sesión europea del 5 de agosto. Informes Commitment of Traders COT (análisis de las operaciones de ayer). Los compradores de la libra muestran cada

Miroslaw Bawulski 08:36 2025-08-05 UTC+2

Cómo operar el par GBP/USD el 5 de agosto. Consejos sencillos y análisis de operaciones para principiantes

El par GBP/USD el lunes tampoco mostró ningún movimiento interesante, aunque sí presentó una inclinación alcista mínima. La volatilidad fue nula, por lo que no tuvo sentido operar

Paolo Greco 08:06 2025-08-05 UTC+2

Cómo operar el par EUR/USD el 5 de agosto. Consejos sencillos y análisis de operaciones para principiantes

El par de divisas EUR/USD se movió exclusivamente de forma lateral el lunes y con una volatilidad mínima. Esperábamos que el mercado continuara procesando los eventos del viernes, pero

Paolo Greco 08:06 2025-08-05 UTC+2

GBP/USD: plan para la sesión americana del 31 de julio (análisis de las operaciones matutinas).La libra sufre otra oleada de ventas

Ayer se formaron varios puntos de entrada al mercado. Veamos el gráfico de 5 minutos y analicemos lo que ocurrió. En mi pronóstico de la mañana presté atención al nivel

Miroslaw Bawulski 07:34 2025-07-31 UTC+2

EUR/USD: plan para la sesión americana del 31 de julio (análisis de las operaciones matutinas). El dólar subió tras la decisión de la Fed

Ayer se formó solo un punto de entrada al mercado. Veamos el gráfico de 5 minutos y analicemos lo que ocurrió. En mi pronóstico de la mañana presté atención

Miroslaw Bawulski 07:34 2025-07-31 UTC+2
¿No puede hablar ahora mismo?
Ingrese su pregunta en el chat.
 

Dear visitor,

Your IP address shows that you are currently located in the USA. If you are a resident of the United States, you are prohibited from using the services of InstaFintech Group including online trading, online transfers, deposit/withdrawal of funds, etc.

If you think you are seeing this message by mistake and your location is not the US, kindly proceed to the website. Otherwise, you must leave the website in order to comply with government restrictions.

Why does your IP address show your location as the USA?

  • - you are using a VPN provided by a hosting company based in the United States;
  • - your IP does not have proper WHOIS records;
  • - an error occurred in the WHOIS geolocation database.

Please confirm whether you are a US resident or not by clicking the relevant button below. If you choose the wrong option, being a US resident, you will not be able to open an account with InstaTrade anyway.

We are sorry for any inconvenience caused by this message.