
Vea también


 06.11.2026 05:07 AM
Thursday's Trade Analysis:
1H chart of EUR/USD.
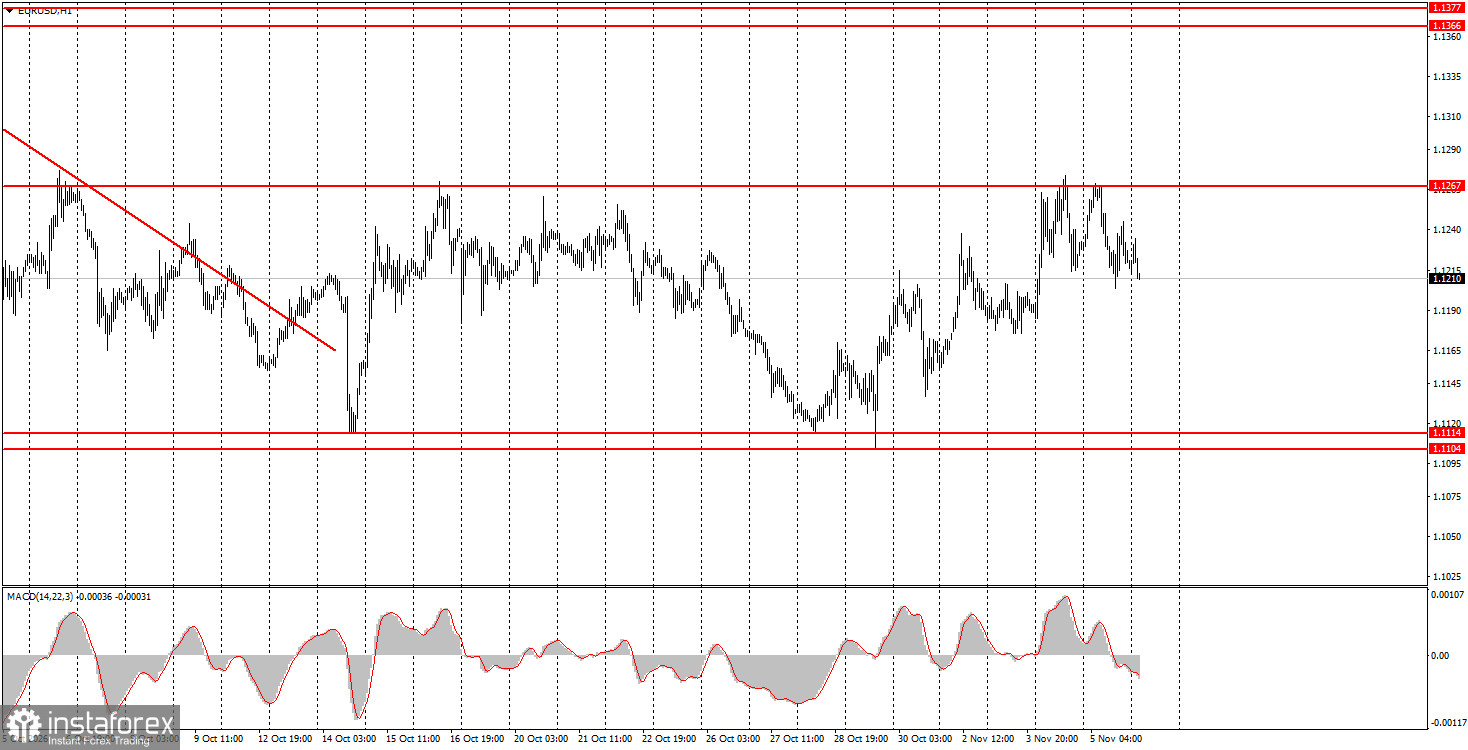
On Thursday, the EUR/USD currency pair once again failed to break above the 1.1267 level, which serves as the upper boundary of the sideways channel on the hourly timeframe. As a result, the pair rebounded from this level again and remained within the sideways channel in which it has been trading for a month. As the euro failed to extend its gains once again, a move toward the lower boundary of the sideways channel, in the 1.1104–1.1114 level, can be expected. The euro continues to demonstrate weakness. More precisely, the market continues to show a complete lack of interest in the single European currency. There were no significant events in the European Union or the United States yesterday, and market attention was focused entirely on the Bank of England's meeting. Today, the US Nonfarm Payrolls report and unemployment rate are due for release, and they could trigger high volatility. However, the euro is likely to remain within the sideways channel.
5M chart of EUR/USD.
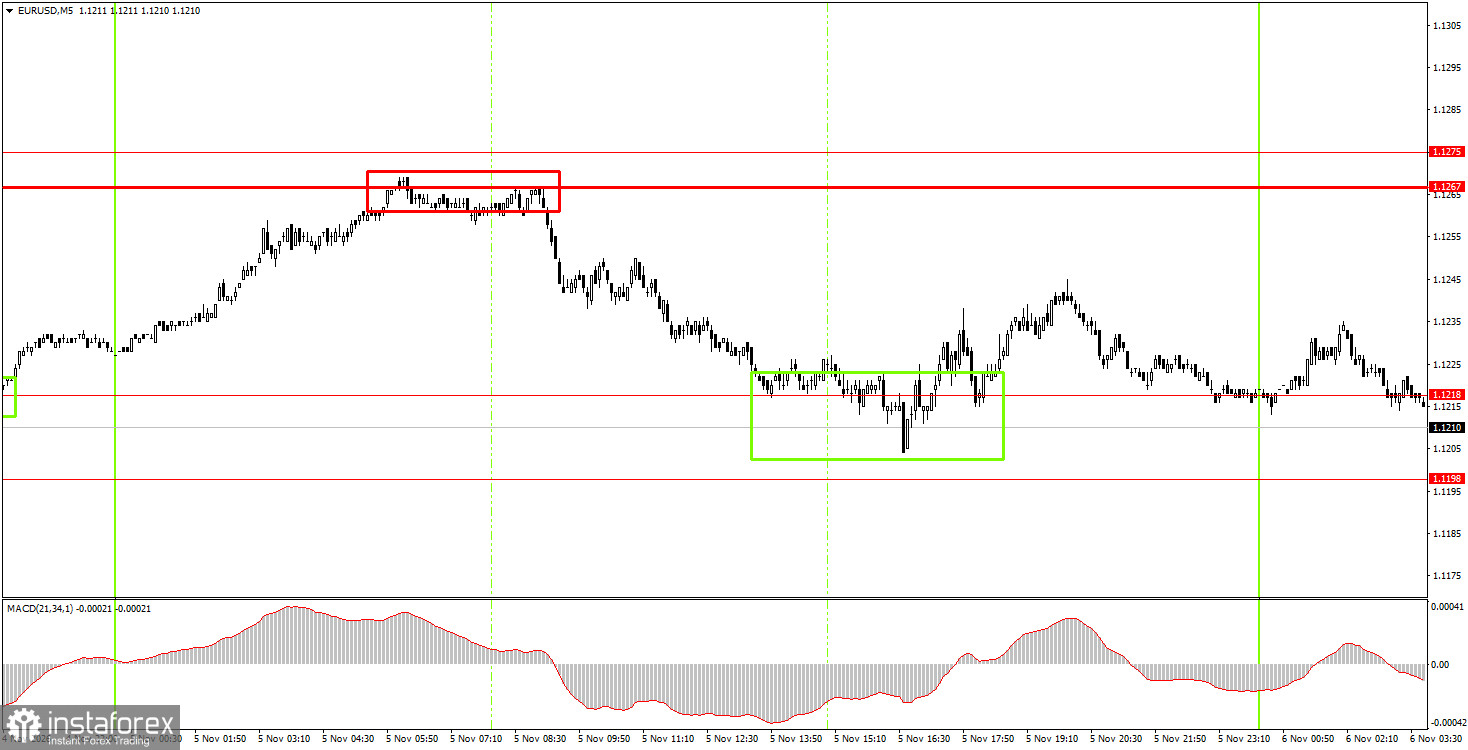
Two trading signals were formed on the 5-minute timeframe on Thursday. At the beginning of the European trading session, the price rebounded from the 1.1267–1.1275 level, providing an opportunity for beginner traders to open simple short positions. A few hours later, the 1.1198–1.1218 level was tested, where profits could have been taken. The rebound from this area provided an opportunity to open long positions. However, the pair did not make any significant moves for the rest of the day, so the profit from this trade was minimal or zero.
How to Trade on Friday:
On the hourly timeframe, EUR/USD maintains a downward trend, which remains firmly established, while the pair continues to move sideways between the 1.1114 and 1.1267 levels. The euro has failed to stage a meaningful correction in recent weeks, although the possibility of an upward trend emerging cannot be ruled out. Considering all the developments of recent months, there is no clear reason why the European currency should have declined so sharply. At present, the US dollar is significantly overbought, while a large number of factors supporting the euro's appreciation are being ignored by the market.
On Friday, beginner traders may consider opening short positions if the price consolidates below the 1.1198–1.1218 level, with a target of 1.1104–1.1114. Long positions may be considered if the price rebounds from the 1.1198–1.1218 level, with a target of 1.1267–1.1275.
On the 5-minute timeframe, the following levels should be considered: 1.1011, 1.1104–1.1114, 1.1198–1.1218, 1.1267–1.1275, 1.1366–1.1377, 1.1461–1.1474, 1.1527–1.1531, 1.1584–1.1594, and 1.1655–1.1665. On Friday, the European Union will publish a relatively minor retail sales report, while the United States will release the much more important Nonfarm Payrolls and unemployment reports. The market reaction to the latter two releases could be significant.
Key Rules of the Trading System:
What the Charts Show:
Price support and resistance levels (areas) – levels that serve as targets for opening buy or sell positions or as sources of trading signals.
Red lines – represent channels or trendlines that show the current trend and indicate the preferred trading direction.
The MACD (14, 22, 3) indicator — its histogram and signal line — is an auxiliary indicator that can also be used to generate trading signals.
Important speeches and economic reports (listed in the economic calendar) can have a significant impact on currency pair movements. Therefore, trading should be approached with extreme caution during their release, or positions should be closed to avoid a sharp price reversal against the preceding movement.
Beginner Forex traders should remember that not every trade can be profitable. Developing a clear trading strategy and applying proper money management are essential to achieving long-term trading success.


