Bearish pennant
was formed on 31.03 at 16:26:39 (UTC+0)
signal strength 2 of 5
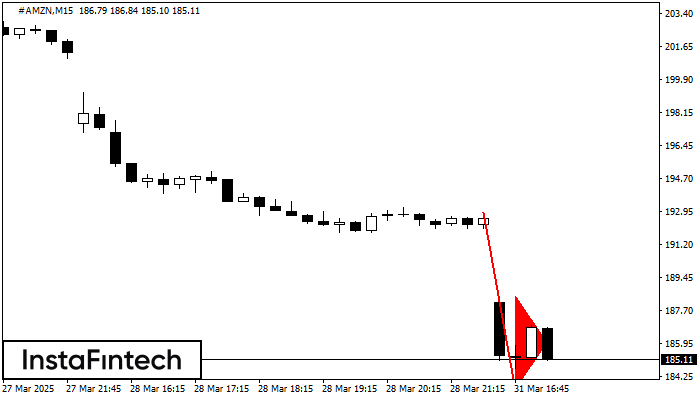
The Bearish pennant pattern has formed on the #AMZN M15 chart. The pattern signals continuation of the downtrend in case the pennant’s low of 183.52 is broken through. Recommendations: Place the sell stop pending order 10 pips below the pattern’s low. Place the take profit order at the projection distance of the flagpole height.
The M5 and M15 time frames may have more false entry points.
Xem thêm
- All
- All
- Bearish Rectangle
- Bearish Symmetrical Triangle
- Bullish Rectangle
- Double Top
- Double Top
- Triple Bottom
- Triple Bottom
- Triple Top
- Triple Top
- All
- All
- Buy
- Sale
- All
- 1
- 2
- 3
- 4
- 5
Đỉnh đôi
was formed on 23.09 at 03:00:41 (UTC+0)
signal strength 3 of 5
Trên biểu đồ AUDCAD M30, mô hình đảo chiều Đỉnh đôi đã được hình thành. Đặc điểm: ranh giới trên ở 0.9123; ranh giới dưới ở 0.9110; chiều rộng
Open chart in a new window
Đỉnh ba
was formed on 23.09 at 02:30:27 (UTC+0)
signal strength 3 of 5
Trên biểu đồ của công cụ giao dịch AUDUSD M30, mô hình Đỉnh ba báo hiệu sự thay đổi xu hướng đã hình thành. Có thể sau khi hình thành
Open chart in a new window
Tam giác Cân Tăng
was formed on 22.09 at 20:17:21 (UTC+0)
signal strength 2 of 5
Theo biểu đồ của M15, GBPCHF đã hình thành mô hình Tam giác Cân Tăng. Mô tả: Đây là mô hình của sự tiếp tục xu hướng. 1.0731 và 1.0691
Khung thời gian M5 và M15 có thể có nhiều điểm vào lệnh sai hơn.
Open chart in a new window