আরও দেখুন

 13.02.2026 05:05 AM
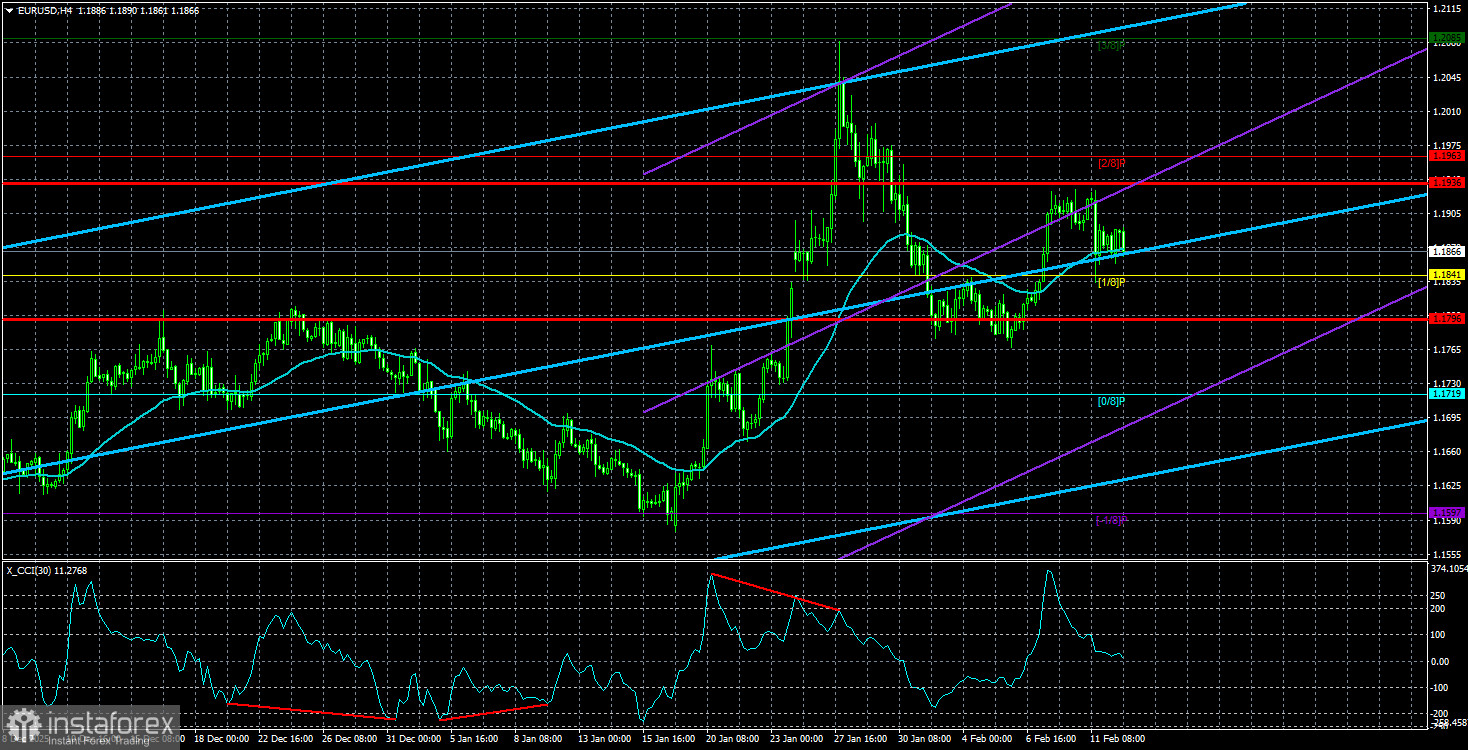
The EUR/USD currency pair traded quite calmly on Thursday, with no significant fundamental or macroeconomic events. In general, the market has somewhat calmed down in recent days, and even the Non-Farm Payrolls report and the unemployment rate could not boost the value of the U.S. dollar. Of course, immediately after the reports were published, the dollar strengthened slightly, but the downward momentum faded quickly.
The lack of convincing growth in the U.S. dollar is easily explained. The U.S. labor market has become something of a paradox lately. Individual reports may show much higher values for a single month, while data from previous periods are regularly revised downward. It seems that the U.S. Bureau of Statistics does not know how to count, as this is far from an isolated case. This week, the value of the entire previous year has been revised, and it turned out that almost half a million fewer jobs were created than previously thought. How can reports be collected over a year if a revision of half a million occurred afterward? What's the point of labor market data if the value of almost any month can be revised downward by several tens of thousands?
On Wednesday, we learned that 130,000 Non-Farm jobs were created in January. And what trust can there be in this figure, which is generally considered quite positive and high compared to forecasts and values of previous months? The market is simply refusing to believe in American data because, on paper or in Trump's speeches, everything looks wonderful: inflation is low, economic growth is high, the budget receives hundreds of billions of dollars in tariffs, a "golden age" is beginning, and so on. Yet, in practice, Americans are having their social and medical programs cut, and various government payments and fees increased. All tariffs are paid by Americans (not by Europe or China), and the 4.4% growth rate hardly affects the average American farmer or Amazon employee.
From our perspective, the dollar is losing yet another serious support factor—economic data. If the market no longer believes in the cloudless state of the American economy and approaches each report with a considerable degree of skepticism, then there is certainly nothing good to expect for the dollar. A week earlier, strong ISM business activity indices were published. How should we view them?
It is worth noting that the U.S. dollar has shown almost no growth over the past seven months, during which the bulls were clearly resting. Since January of last year, the dollar's maximum growth has been 400 pips. In total, the American currency lost about 1600 pips over this time. Thus, we still see no grounds for the U.S. dollar to grow, if we speak of more than one or two days.
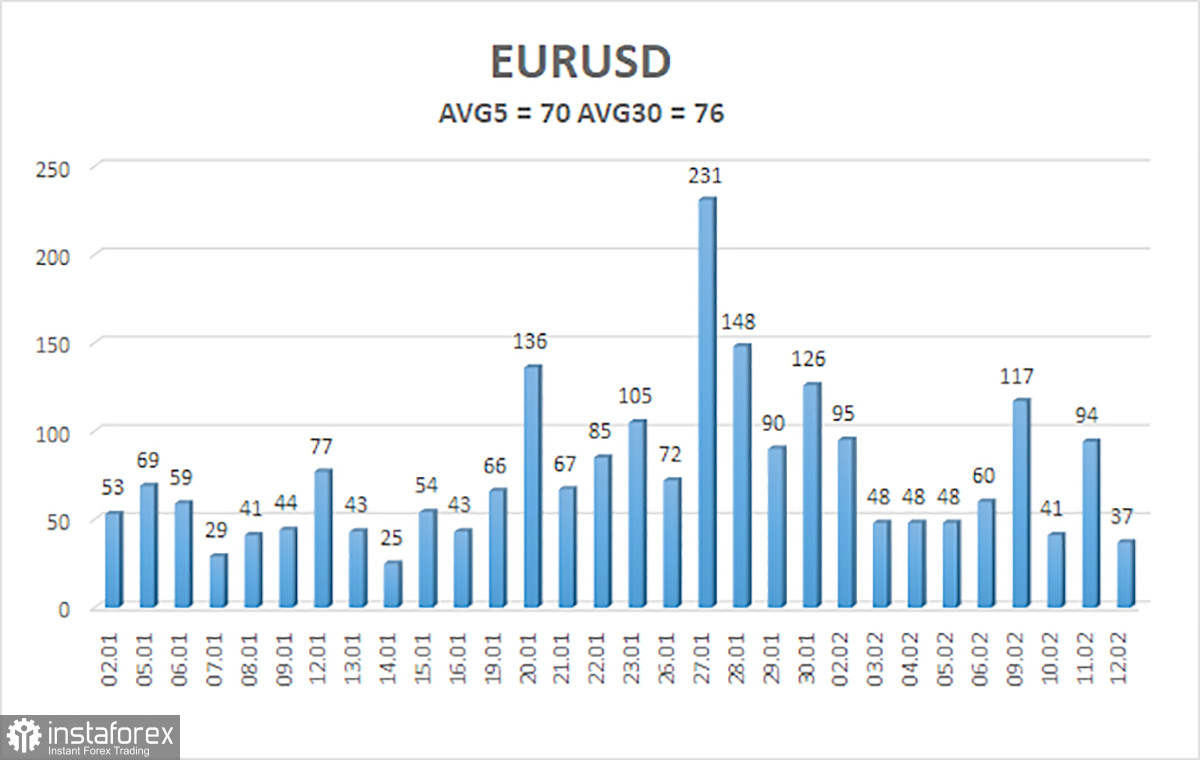
The average volatility of the EUR/USD currency pair over the last 5 trading days as of February 13 is 70 pips, which is considered "average." We expect the pair to trade between 1.1796 and 1.1936 on Friday—the upper channel of the linear regression points upward, suggesting further gains for the euro. The CCI indicator has entered the overbought zone, signaling a possible downward correction.
S1 – 1.1841
S2 – 1.1719
S3 – 1.1597
R1 – 1.1963
R2 – 1.2085
R3 – 1.2207
The EUR/USD pair continues a fairly strong correction within the upward trend. The global fundamental background remains extremely negative for the dollar. The pair has spent seven months in a sideways channel, and it is likely time to resume the global trend of 2025. There is no fundamental basis for the dollar's long-term growth. Therefore, all the dollar can hope for is a flat or a correction. With the price positioned below the moving average, small shorts can be considered with a target of 1.1719 on purely technical grounds. Above the moving average line, long positions remain relevant with targets of 1.1963 and 1.2085.


