
আরও দেখুন


 05.10.2026 11:08 AM
On Friday, EUR/USD made another rebound from the 127.2% retracement level at 1.1220, which provided no support for the euro. On Monday night, sellers resumed selling pressure and consolidated below the 1.1220 level. Therefore, the decline may continue toward the 1.1081–1.1086 support level. Consolidation above the 1.1220 level would allow traders to expect a modest rise.
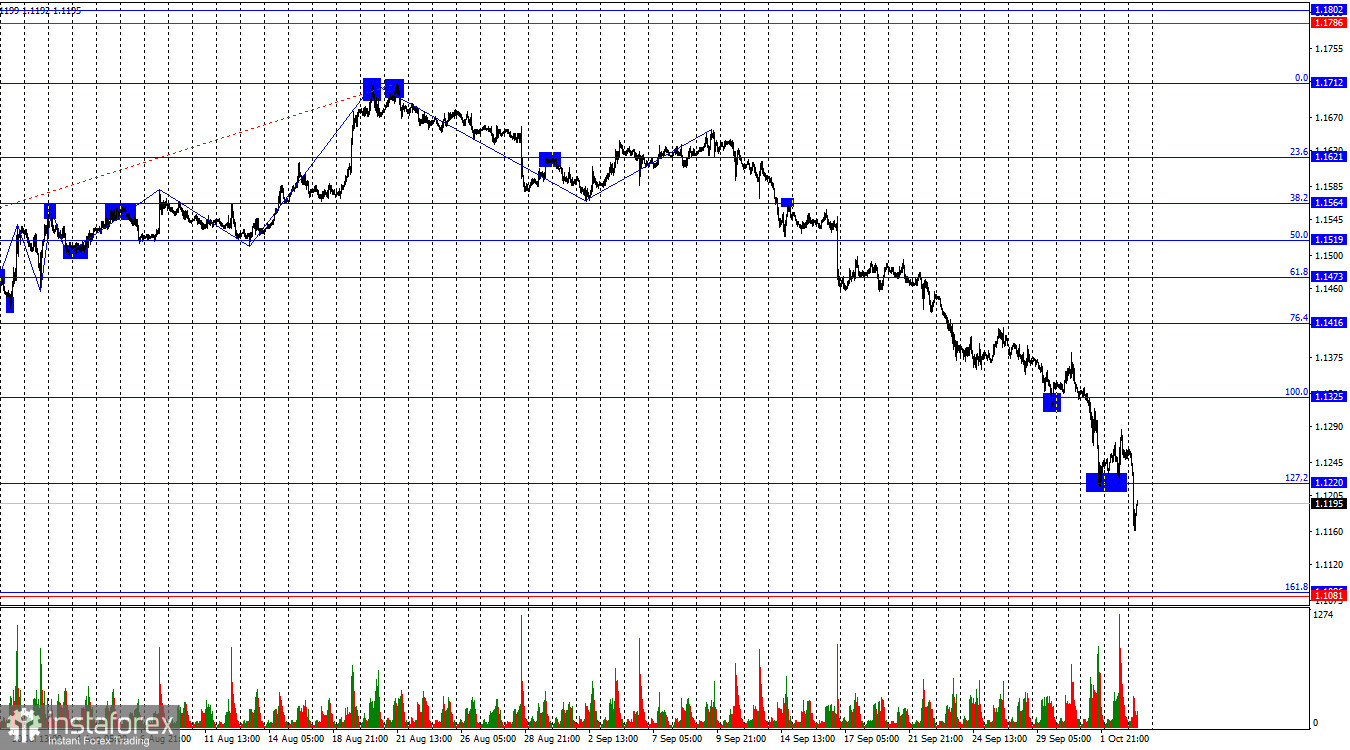
The wave structure on the hourly chart remains bearish. The latest completed upward wave failed to break the previous peak, while the latest downward wave broke the previous low and has continued forming for the fourth consecutive week. Following the September FOMC meeting, traders expect at least one more monetary policy tightening before the end of the year and another one next year. This factor continues to provide strong support for the US currency.
The fundamental background on Friday was entirely favorable for buyers, but buyers did not respond to it. More precisely, this has been the case for a month already. The Nonfarm Payrolls report and the unemployment rate could not reasonably be interpreted in a way that would provide the dollar with any meaningful basis for growth given these figures. Nevertheless, traders found a way to respond to the situation by simply ignoring the weakness in the labor market and the increase in unemployment. Most likely, the market concluded that the labor market reports would not change anything and that the FOMC would continue tightening monetary policy regardless. Whether this happens in October or December was considered irrelevant. As a result, the dollar strengthened again, while the latest geopolitical developments could continue to support selling pressure for some time. I would also note that several FOMC policymakers confirmed the regulator's hawkish stance last week, although, of course, they were not yet aware of the latest labor market and unemployment data at that time. Therefore, the overall stance of the Fed could become more accommodative this week. However, the key factor is how the market interpreted the situation. The market has clearly answered that question.
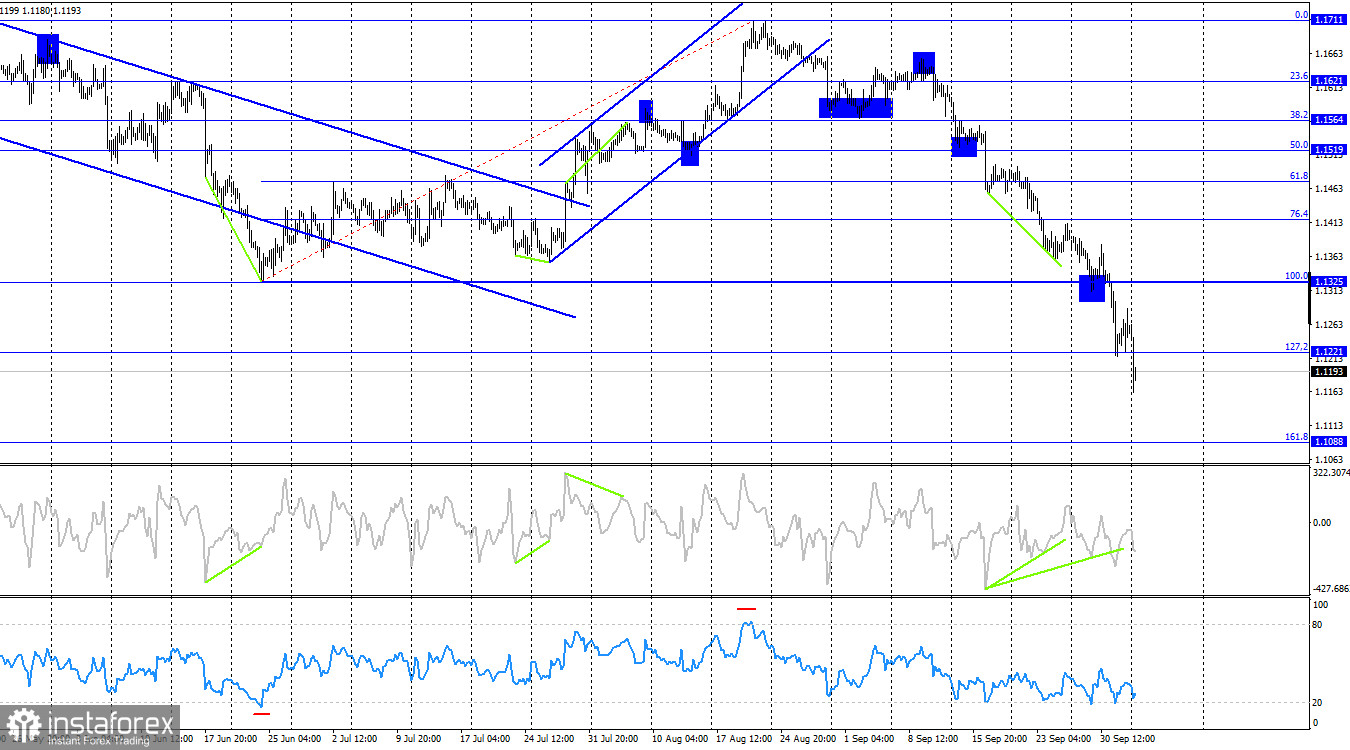
On the 4-hour chart, the pair consolidated below the 127.2% Fibonacci level at 1.1220, allowing for expectations of a continued decline in the euro toward the next retracement level of 161.8% at 1.1088. There are currently no new emerging divergences, but they are not necessary, as traders would likely ignore them anyway.
Commitments of Traders (COT) Report:
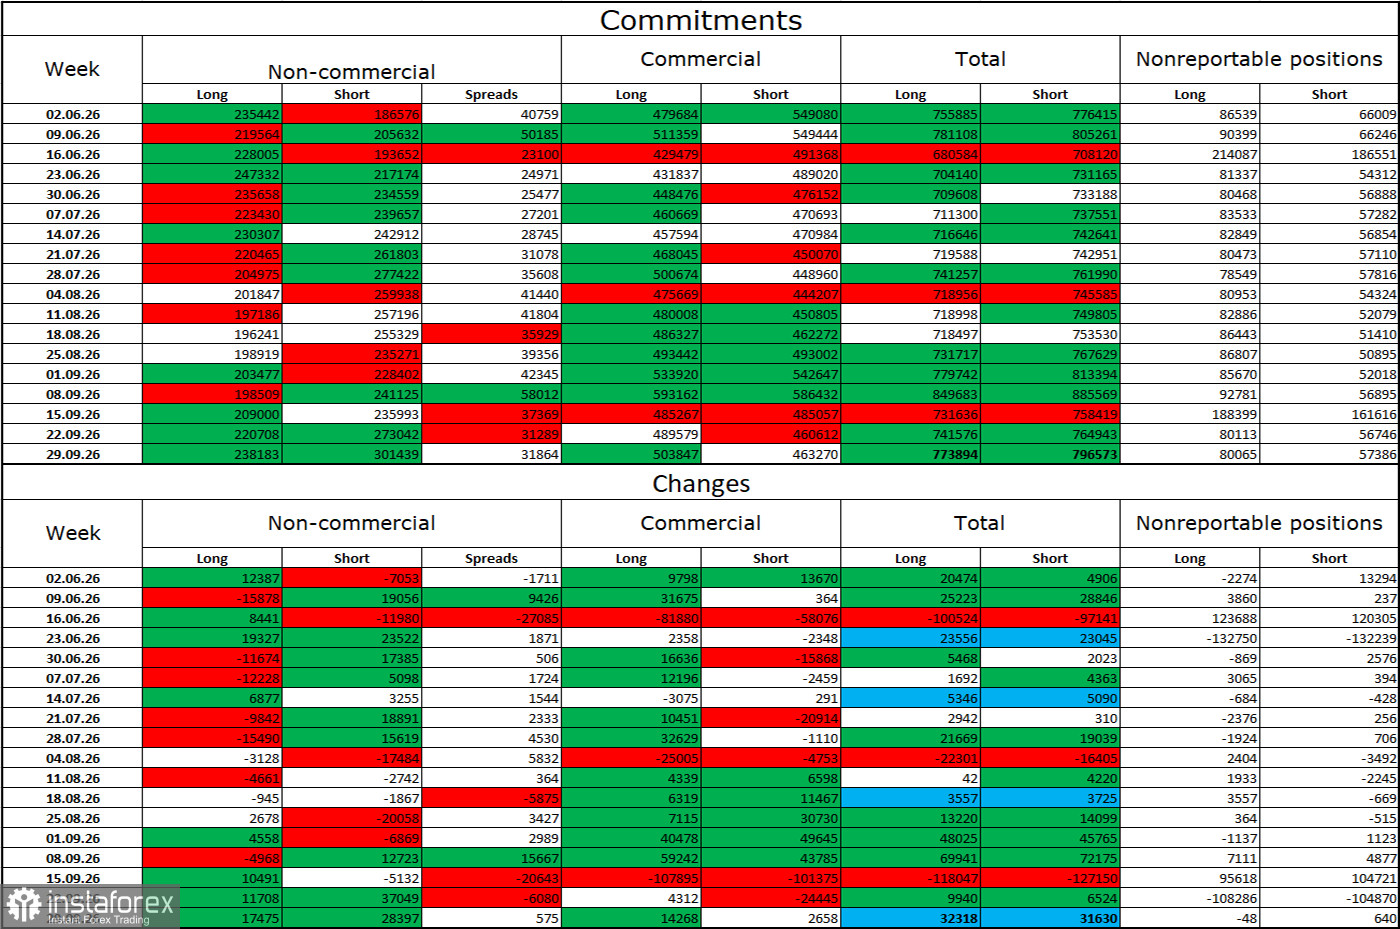
During the latest reporting week, professional traders opened 17,475 Long positions and 28,397 Short positions. The total number of Long positions held by speculators currently stands at 238,000, while the number of Short positions is 301,000. Sellers remain in control, and the euro continues to be sold more frequently than it is bought. This is explained by the difficult geopolitical situation in the Middle East and Kevin Warsh's strong commitment to achieving lower inflation. The market continues to believe that inflation will be reduced to 2% by any available means.
Overall, over the longer term, major market participants continue to show significant interest in the euro. At the same time, events of various kinds around the world, which have been particularly numerous in recent years, affect investor sentiment and put pressure on risk-sensitive currencies. 2026 could therefore set a record for the number of events that could not have been predicted in advance. As a result, traders have little choice but to adjust their strategies as conditions change.
US and European Union Economic Calendar:
The economic calendar for October 5 contains two events, of which I would highlight the ISM index. Economic data will influence market sentiment during the second half of Monday's trading session.
EUR/USD Forecast and Trading Recommendations:
Long positions can be considered today if the pair rebounds from the 1.1081–1.1086 level on the hourly chart, with targets at 1.1220 and 1.1325. Short positions were available after consolidation below the 1.1325 level and after consolidation below the 1.1220 level. The target is 1.1081–1.1086.
The Fibonacci grids are drawn from 1.1325–1.1712 on the hourly chart and from 1.1325–1.1712 on the 4-hour chart.


