यह भी देखें

 10.02.2026 12:50 PM
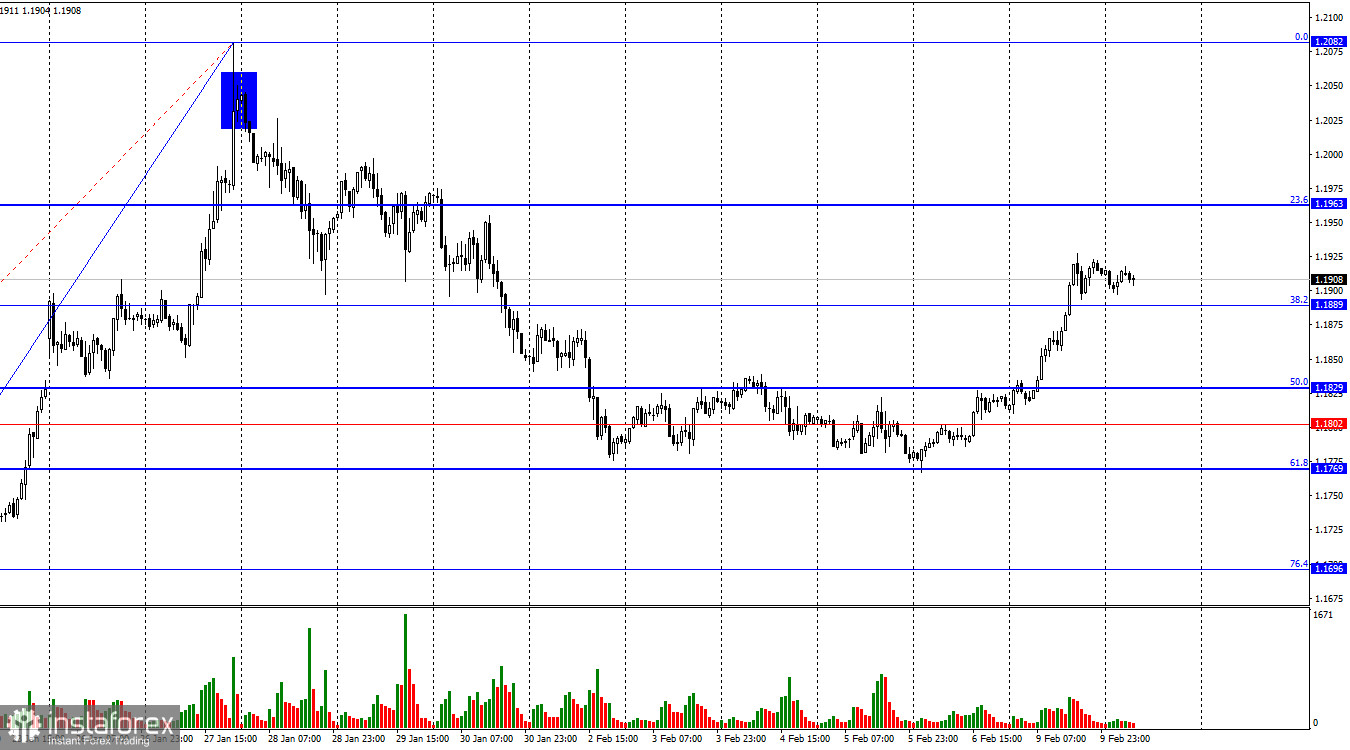
During Monday, the EUR/USD pair consolidated above the 50.0% corrective level at 1.1889, which I suggested considering for opening buy positions. By the end of the day, the European currency had consolidated above the 38.2% Fibonacci level at 1.1889. Thus, the growth process may continue today toward the next corrective level of 23.6% at 1.1963. A consolidation of the pair below 1.1889 would work in favor of the U.S. currency and a return to the 1.1769–1.1829 level.
The wave picture on the hourly chart remains simple. The last completed downward wave did not break the low of the previous wave, and the new upward wave has not yet broken the previous low. Thus, the trend remains "bullish." Bulls have taken a short pause within a large-scale offensive that might not have happened without Donald Trump. Trump has pushed tensions in the world and within the United States to the limit, and markets continue to react by fleeing from the risky U.S. currency with uncertain economic prospects.
On Monday, there was no news background in either the U.S. or the EU, but the market resumed selling the dollar. Why? In my view, the factor of uncertainty once again played a role. Last week, the Nonfarm Payrolls and unemployment reports were not released. Yet these reports help traders forecast future changes in the Fed's monetary policy. Donald Trump announced the name of the new FOMC chairman, but traders still do not understand what line Kevin Warsh will follow. Previously, he repeatedly spoke out against expanding the Fed's balance sheet and cutting interest rates. However, he will now be under pressure from Donald Trump, who is demanding monetary easing. As a result, traders prefer to sell the dollar, not understanding what future awaits the Fed, what new trade tariffs Donald Trump may introduce in the near future, or how the story with Jerome Powell and the judicial investigation will end. Tomorrow, the labor market and unemployment reports will be released, which could help both bears and bulls. Traders will monitor compliance with forecasts, paying little attention to the overall weakness of both indicators.
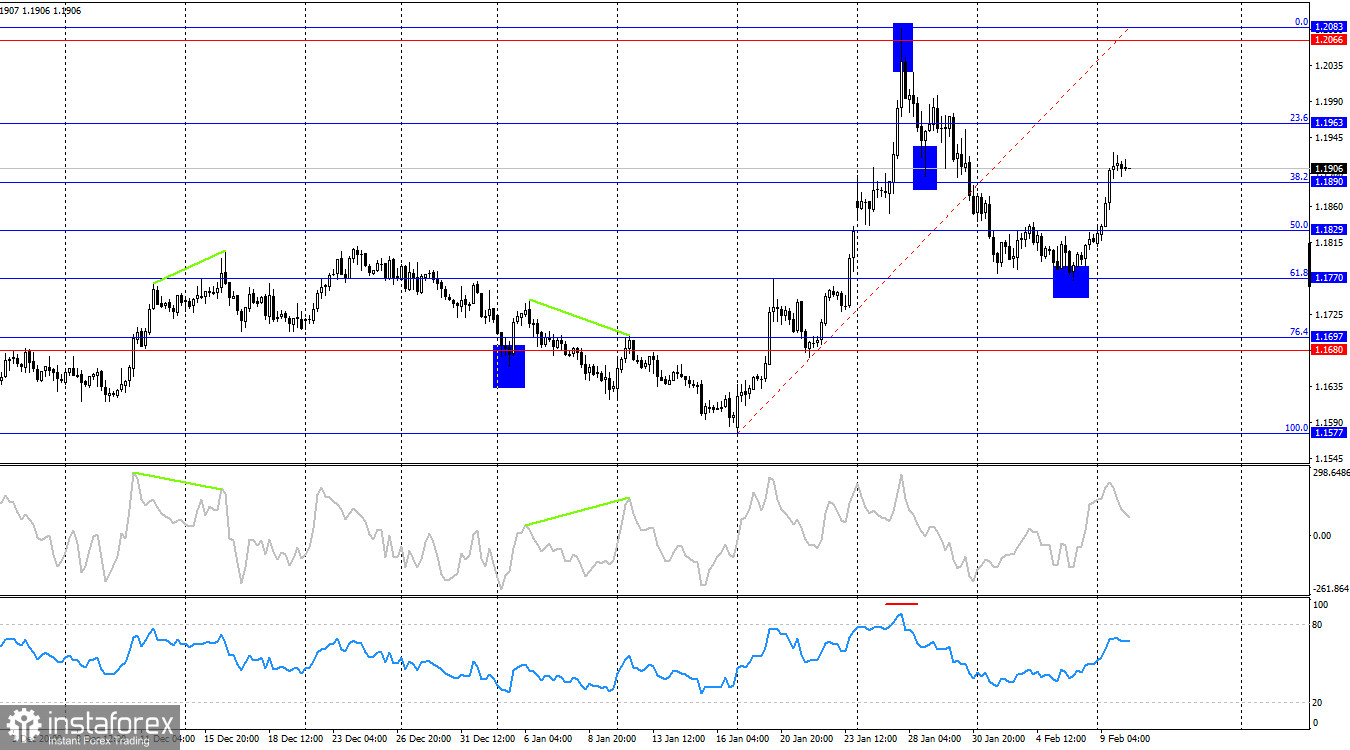
On the 4-hour chart, the pair rebounded from the 61.8% corrective level at 1.1770, reversed in favor of the European currency, and consolidated above the 38.2% Fibonacci level at 1.1890. Thus, in the near term, the growth process may continue all the way to the 0.0% corrective level at 1.2083. No emerging divergences are observed today on any indicator.
Commitments of Traders (COT) report:
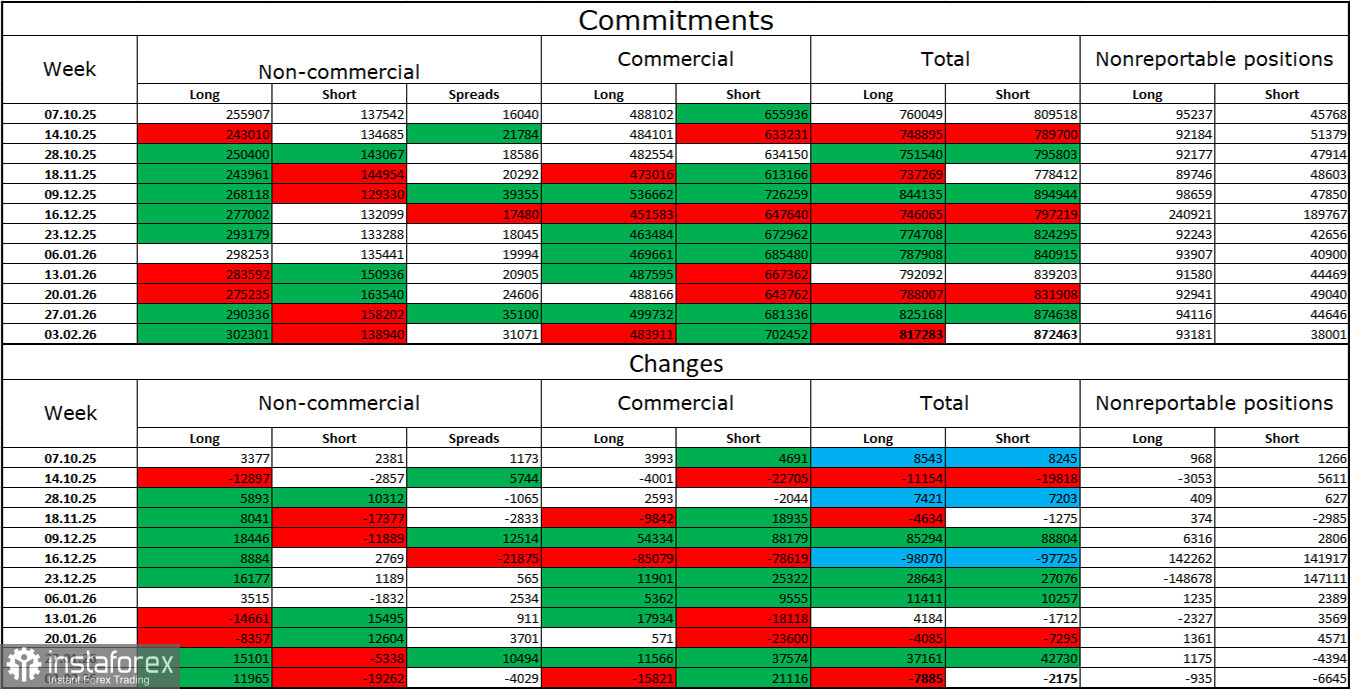
During the latest reporting week, professional players opened 11,965 long positions and closed 19,262 short positions. Sentiment in the "Non-commercial" group remains "bullish" thanks to Donald Trump and his policies, and continues to strengthen over time. The total number of long positions held by speculators now stands at 302,000, while short positions total 138,000. This is more than a twofold advantage for the bulls.
For thirty-three consecutive weeks, large players were reducing short positions and increasing longs. Then the "shutdown" began, and now we are seeing the same picture: professional traders continue to build long positions. Donald Trump's policies remain the most significant factor for traders, as they create numerous problems that will have long-term and structural consequences for the United States—for example, deterioration of the labor market and a decline in global reputation. Traders are also concerned about a possible loss of the Fed's independence in 2026 and Donald Trump's geopolitical ambitions.
News calendar for the U.S. and the European Union:
On February 10, the economic calendar contains two entries that are unlikely to save the dollar from another decline. The impact of the news background on market sentiment on Tuesday will be weak.
EUR/USD forecast and trading advice:
Selling the pair today is possible if the hourly chart closes below 1.1889, with a target of 1.1829. Buying opportunities were available on a close above 1.1829 on the hourly chart, with targets at 1.1889 and 1.1963. The first target has been reached. Buy trades can be left open.
Fibonacci grids are drawn from 1.1805–1.1578 on the hourly chart and from 1.1577–1.2083 on the 4-hour chart.

