Veja também

 30.06.2026 04:54 AM
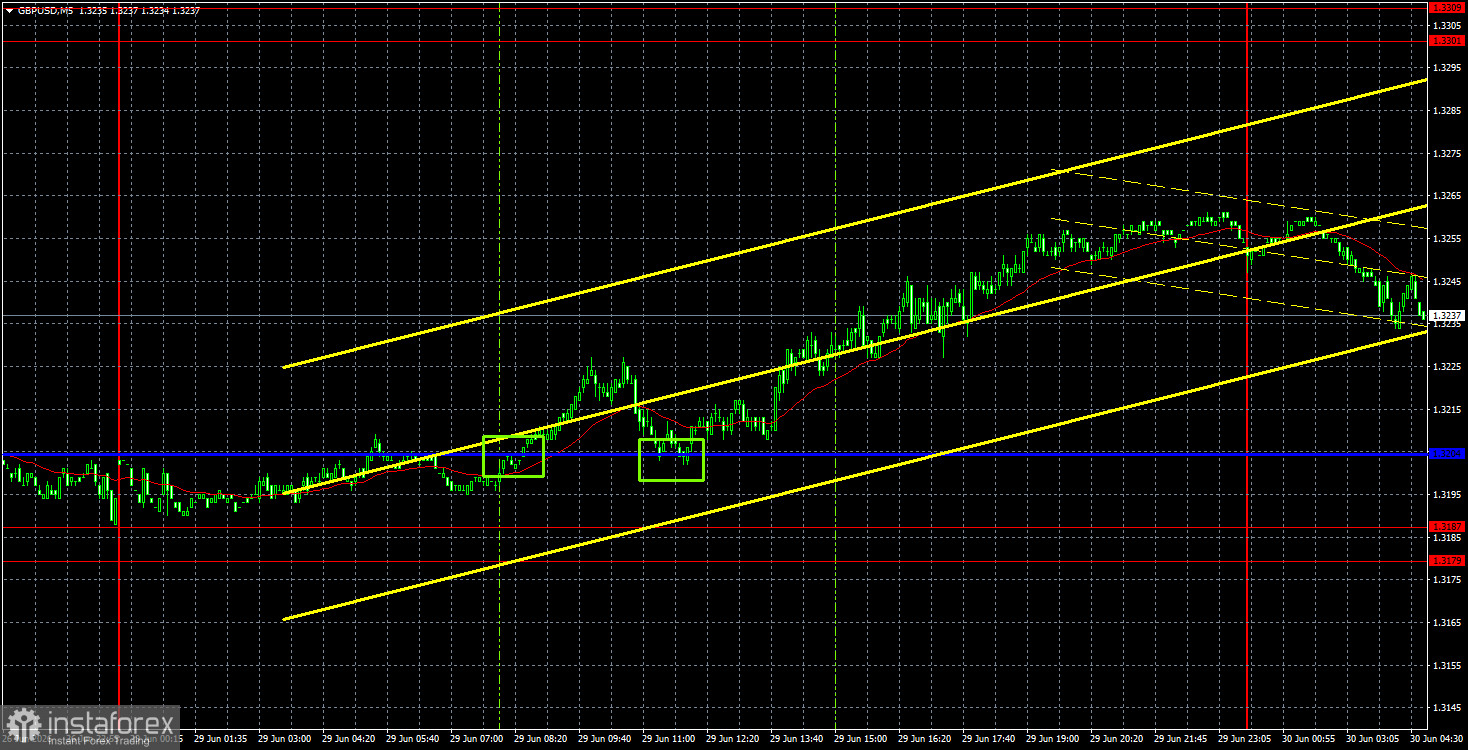
The GBP/USD currency pair attempted to continue its upward correction on Monday; however, it had no fundamental or macroeconomic support. The market is virtually ignoring geopolitical issues at this point. Last week, Iran and the US resumed attacks in the Persian Gulf, but on Monday they agreed to another ceasefire. Thus, the situation in the Middle East remains unchanged. Tehran and Washington continue to regularly violate the ceasefire terms, fearing showing weakness in negotiations. However, talks on Iran's nuclear program and the status of the Strait of Hormuz are ongoing. There has been no progress, but both sides have two months to reach a consensus. As mentioned, the market is not interested in this news. Attention has completely shifted to the Federal Reserve, and other factors are being ignored. Therefore, even if the dollar does not rise, it is not falling in the medium term. A considerable number of important reports will be released in the US this week, so the market will be looking for new reasons to buy the US dollar.
From a technical perspective, the price is above the 1.3179-1.3187 range, which can be considered support for the British currency. Another drop below this area could send the pound into a new free fall. Above the critical line, there are certain chances for an upward correction targeting the Senkou Span B line. There is currently no trend line, as the movement is choppy and lacks a clearly defined second extreme. The only positive point for the pound is the upward trend on the weekly timeframe.
On the 5-minute timeframe on Monday, two buy trading signals were formed. First, the price broke through the Kijun-sen line and then bounced off it from above. By the end of the day, the British pound appreciated by approximately 40 pips. The British currency may continue to grow today, but there are no new signals yet.
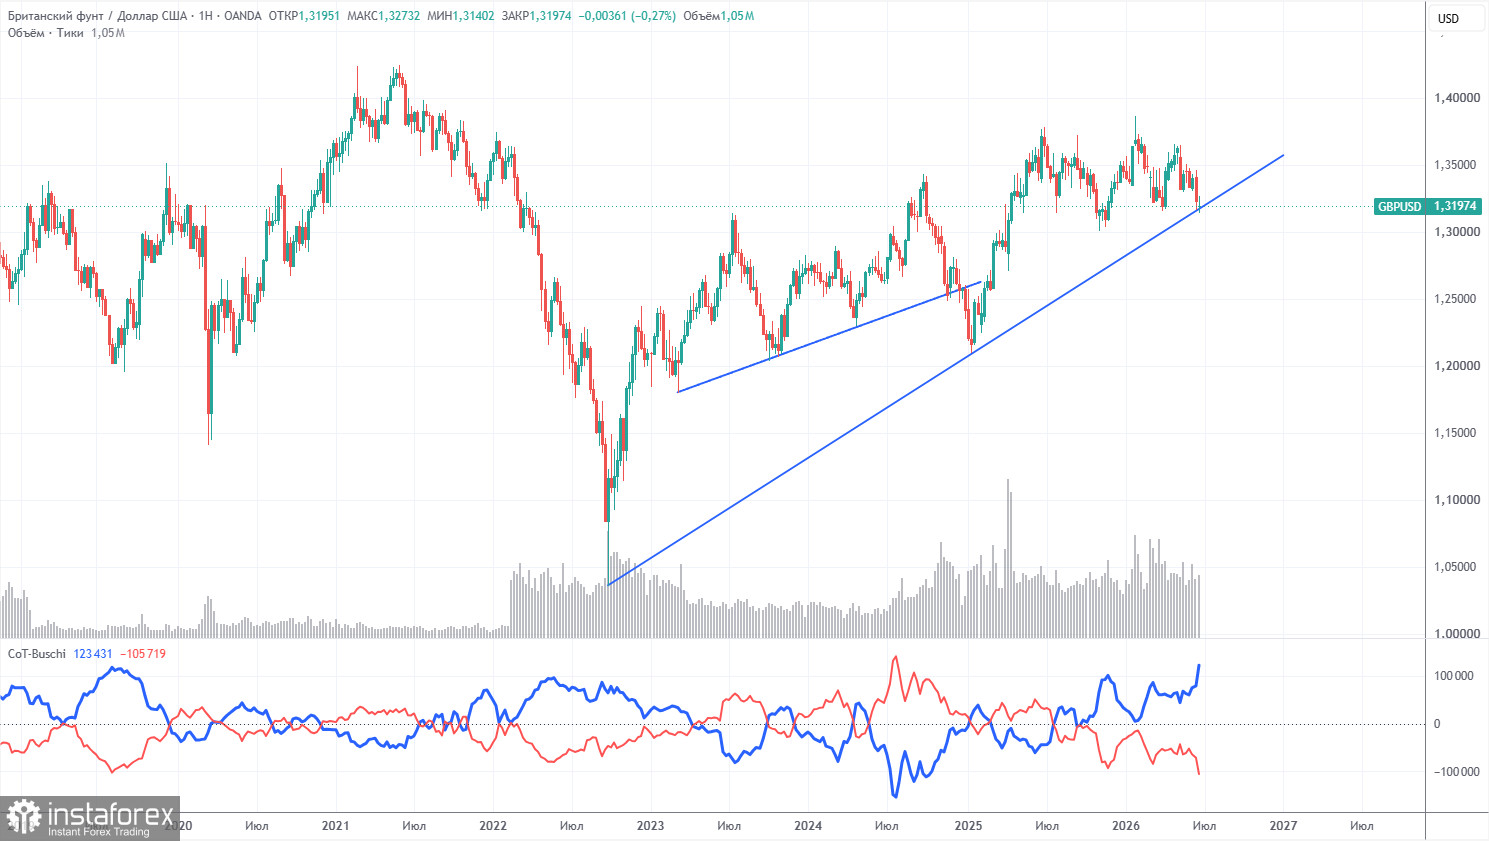
COT reports on the British pound indicate that sentiment among commercial traders has been constantly shifting over the past few years. The red and blue lines representing the net positions of commercial and non-commercial traders frequently cross and are mostly close to the zero mark. Currently, the lines are distancing from each other, with non-commercial traders still dominating with... sales. Given the events in the Middle East, it is not surprising that demand for risky currencies remains low.
In the long term, the dollar continues to decline due to Donald Trump's policies, as clearly visible on the weekly timeframe. The trade war will continue in one form or another for a long time, and Trump's policies are aimed, both directly and indirectly, at weakening the US currency. However, geopolitical factors currently remain paramount, providing strong support for the dollar in 2026. Since the conflict in the Middle East is not yet resolved, the US dollar may still see further growth. According to the latest COT report (dated June 23), the "Non-commercial" group closed 1,300 BUY contracts and opened 32,900 SELL contracts. Thus, the net position of non-commercial traders decreased by another 31,600 contracts over the week.
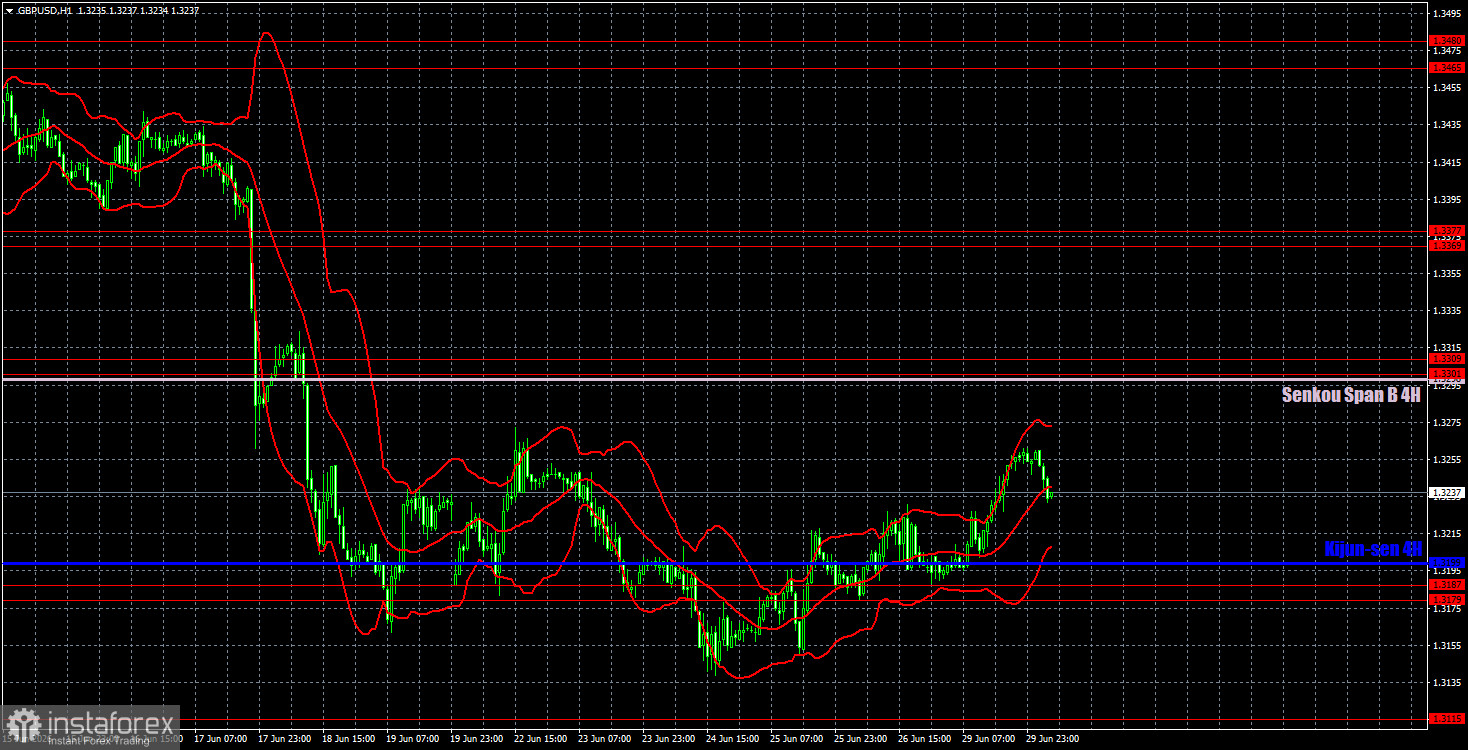
On the hourly timeframe, the GBP/USD pair continues its downward trend, which does not align with the local fundamental and geopolitical backdrop. However, the market has ignored both fundamentals and macroeconomics for three months and is now also ignoring geopolitics, selectively responding to factors. We do not consider the recent decline in the British currency justified, but the technical picture indicates a continuation of the downward trend.
For June 30, we highlight the following important levels: 1.3042-1.3050, 1.3096-1.3115, 1.3179-1.3187, 1.3301-1.3309, 1.3369-1.3377, 1.3465-1.3480, 1.3588, 1.3671-1.3681. The Senkou Span B line (1.3298) and Kijun-sen line (1.3199) may also serve as sources of signals. It is recommended to set the Stop Loss to break even when the price moves in the correct direction by 20 pips. The Ichimoku indicator lines may shift throughout the day, which should be taken into account when determining trading signals.
On Tuesday, one report is scheduled to be released in both the UK and the US. The JOLTs report on job openings will be published in the US today. However, it should be noted that this report is released with a two-month delay, so the market typically assesses the labor market condition based on factors other than the JOLTs report.
Today, traders may consider short positions targeting 1.3179-1.3187 if the pair bounces from the 1.3301-1.3309 area. Long positions can be opened on a new price bounce from the critical line or from the 1.3179-1.3187 range, targeting 1.3301-1.3309.


