empty
28.09.2023 06:03 AM
Trading Signals for GOLD (XAU/USD) for September 28 - 29, 2023: buy bove 1,867 (oversold - GAP)

This image is no longer relevant

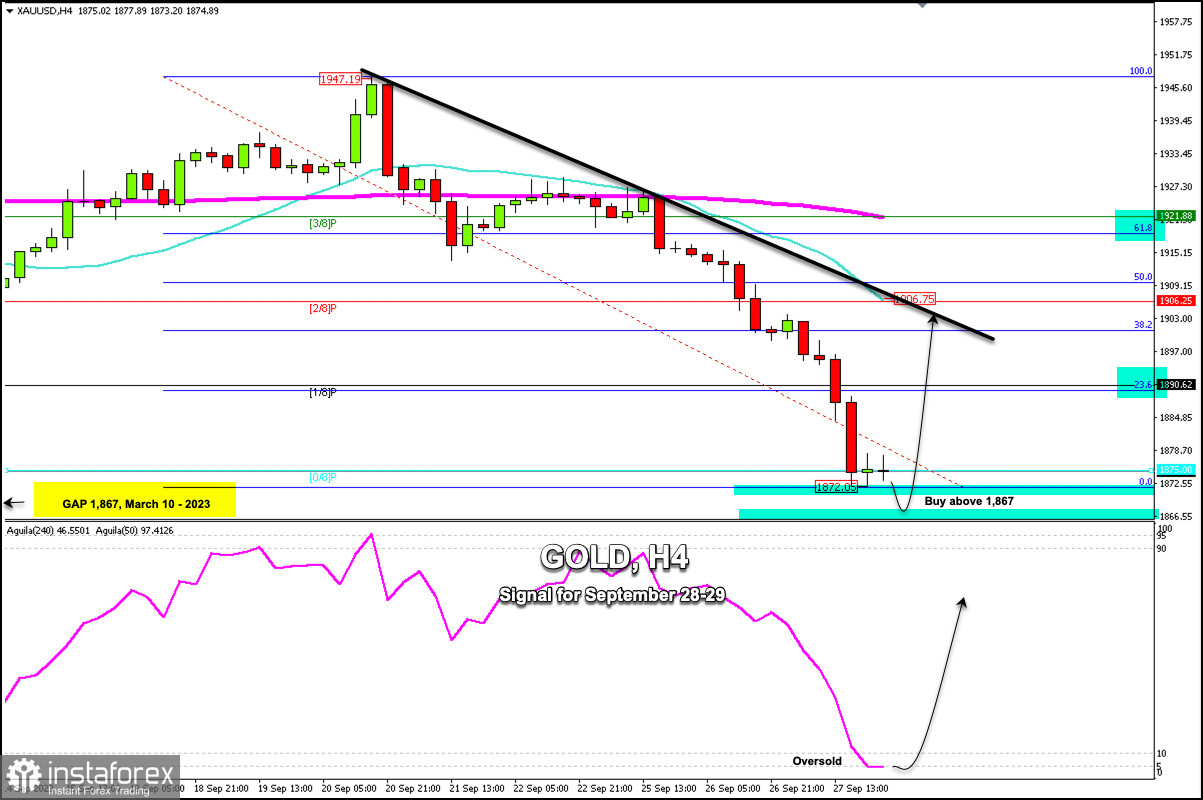
Early in the European session, Gold is trading around 1,874.75 around 0/8 Murray and bouncing slightly after it hit the low around 1,872.20, a level last seen in March 2023.

This sharp drop of almost $75.00 in the last 7 days from the high of 1,947 means the risk aversion of investors and the fears that surround it.

According to the H-4 chart, gold has reached extremely oversold levels. The metal is expected to see a technical rebound in the coming days and the price could reach 2/8 Murray located at 1,906.

Gold accelerated its fall after breaking the psychological level of 1,900 due to the pressure of the US dollar index and the rise in the yields of the 10-year Treasury bonds that reached a high of 4.65%. This generated risk aversion and investors left gold as a refuge asset and supported the dollar.

There is a possibility that the price of gold will fall to the level of 1,867 because gold left a Gap on March 10, 2023, that still needs to be covered. This level could be the key for a strong technical rebound and from that point, a recovery of the yellow metal could occur.

On the other hand, there is a possibility that gold will rebound from the current levels above 1,872 because that area is located at 0/8 Murray which acts as strong support. This level could offer an opportunity to buy with targets at 1,885 and at 1,906. The eagle indicator is showing signs of an imminent technical rebound due to oversold conditions.

Dimitrios Zappas,
Analytical expert of InstaTrade
© 2007-2025

Recommended Stories

XAU/USD. Analysis and Forecast

On Monday, intraday declines pushed gold prices below the 3365 level, but oscillators on the daily chart have not yet started to gain negative momentum. This suggests that the precious

Irina Yanina 19:34 2025-08-11 UTC+2

Trading Signals for EUR/USD for August 11-15, 2025: sell below 1.1650 (200 EMA - 7/8 Murray)

Early in the American session, the euro is trading around 1.1590. After a failed breakout of the downtrend channel, EUR/USD fell below the 21 SMA and below the 7/8 Murray

Dimitrios Zappas 17:54 2025-08-11 UTC+2

Trading Signals for GOLD (XAU/USD) for August 11-15, 2025: sell below $3,380 or buy if rebound 3,341 (21 SMA - 7/8 Murray)

The eagle indicator is showing a negative signal, so we must be very cautious if we are buying, as the bearish force is likely to intensify in the coming hours

Dimitrios Zappas 17:51 2025-08-11 UTC+2

Forecast for EUR/USD on August 11, 2025

On Friday, EUR/USD made two rebounds from the 1.1637–1.1645 support zone and turned in favor of the euro. This means the upward movement could continue today toward the 76.4% Fibonacci

Samir Klishi 10:44 2025-08-11 UTC+2

Forecast for GBP/USD on August 11, 2025

On the hourly chart, GBP/USD on Friday made two rebounds from the 1.3425 level, and on Monday continues moving upward toward the 76.4% retracement level at 1.3470. A rebound from

Samir Klishi 10:25 2025-08-11 UTC+2

Forex forecast 11/08/2025: EUR/USD, USD/JPY, GBP/USD, Gold, Ethereum and Bitcoin

Useful links: My other articles are available in this section InstaForex course for beginners Popular Analytics Open trading account Important: The begginers in forex trading need to be very careful

Sebastian Seliga 10:20 2025-08-11 UTC+2

GBP/USD. Technical Analysis for the Week of August 11–16

Trend Analysis This week, from the 1.3450 level (close to the last weekly candle), the price may start moving downward toward 1.3270 – a historical support level (blue dotted line)

Stefan Doll 10:02 2025-08-11 UTC+2

EUR/USD. Technical Analysis for the Week of August 11–16

Last week, the pair moved upward, almost testing the historical resistance level at 1.1710 (blue dotted line), and then turned downward, closing the weekly candle at 1.1641. In the coming

Stefan Doll 09:55 2025-08-11 UTC+2

GBP/USD. Indicator Analysis on August 11, 2025

On Friday, the pair moved downward, tested the 61.8% retracement level at 1.3416 (red dotted line), and then rose, closing the daily candle at 1.3450. Today, the price will attempt

Stefan Doll 09:53 2025-08-11 UTC+2

EUR/USD. Indicator Analysis on August 11, 2025

On Friday, the pair moved downward, almost testing the 23.6% retracement level at 1.1626 (blue dotted line), after which the price rose slightly and closed the daily candle at 1.1641

Stefan Doll 09:40 2025-08-11 UTC+2
Can't speak right now?
Ask your question in the chat.
 

Dear visitor,

Your IP address shows that you are currently located in the USA. If you are a resident of the United States, you are prohibited from using the services of InstaFintech Group including online trading, online transfers, deposit/withdrawal of funds, etc.

If you think you are seeing this message by mistake and your location is not the US, kindly proceed to the website. Otherwise, you must leave the website in order to comply with government restrictions.

Why does your IP address show your location as the USA?

  • - you are using a VPN provided by a hosting company based in the United States;
  • - your IP does not have proper WHOIS records;
  • - an error occurred in the WHOIS geolocation database.

Please confirm whether you are a US resident or not by clicking the relevant button below. If you choose the wrong option, being a US resident, you will not be able to open an account with InstaTrade anyway.

We are sorry for any inconvenience caused by this message.