empty
09.11.2023 10:15 AM
Technical Analysis of EUR/USD for November 9, 2023

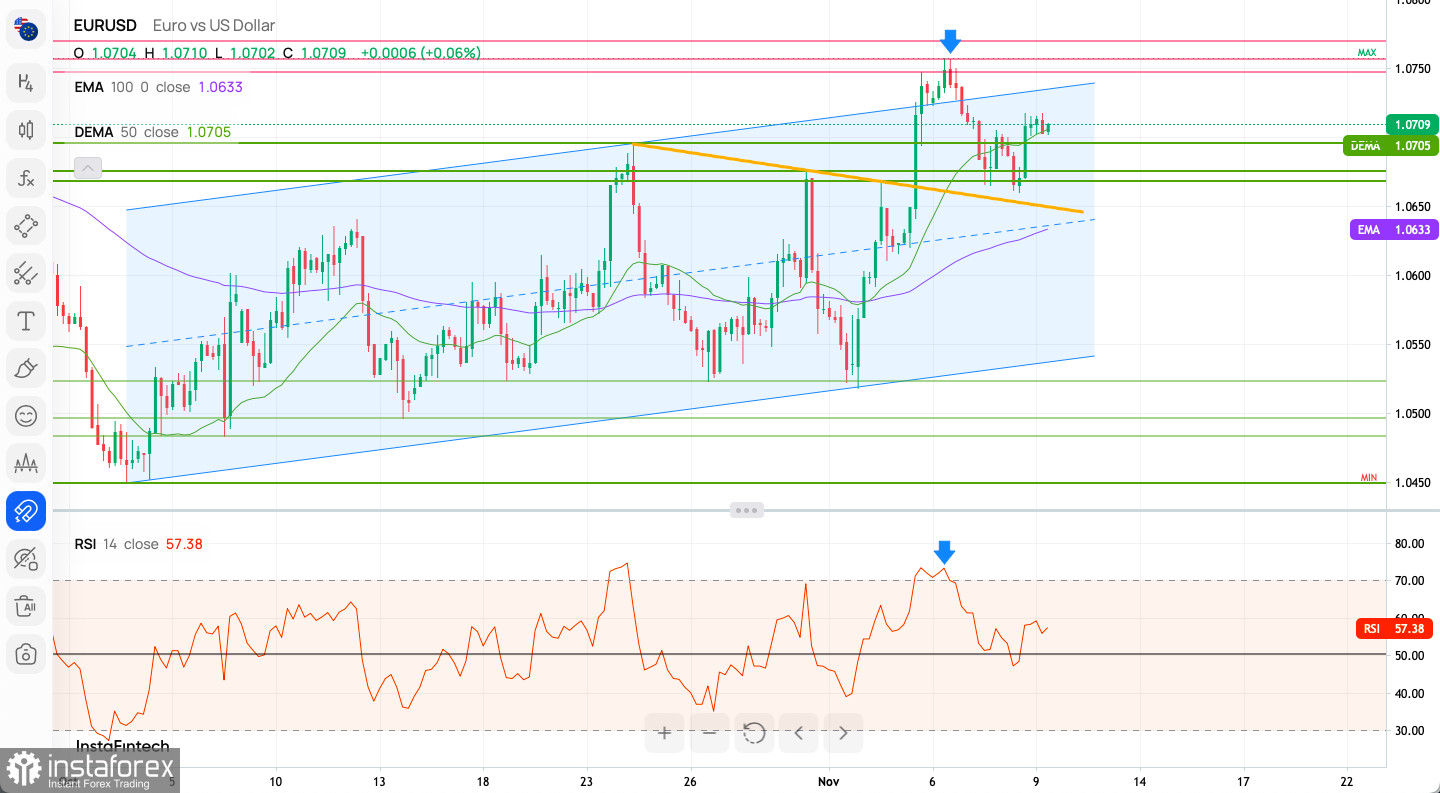
Technical Market Outlook:

The EUR/USD pair has bounced from the technical support located at the level of 1.0668 after the pull back had been terminated. The nearest technical resistance is located at the level of 1.0757 and the intraday technical support is still seen at the level of 1.0668. In a case of a breakout lower, the next target for bears is seen at the level of 1.0649 (the intraday trend line support) and 1.0615. The momentum is now strong and positive, so the market is ready to continue the up move. The next target is the swing high located at the level of 1.0757.

This image is no longer relevant

Weekly Pivot Points:

WR3 - 1.1043

WR2 - 1.0895

WR1 - 1.0813

Weekly Pivot - 1.0665

WS1 - 1.0583

WS2 - 1.0435

WS3 - 1.0353

Trading Outlook:

Since the beginning of October 2022 the EUR/USD is in the corrective cycle to the upside, but the main, long-term trend remains bearish. This corrective cycle was terminated at the level of 1.1286 which is 61% Fibonacci retracement level and the market reversed lower. The intermediate down move is 17 weeks long now, but just recently the market started an internal upwards correction. The key weekly technical resistance is seen at the level of 1.0829. The RSI 14) indicator has just come back to the level of fifty.

Recommended Stories

XAU/USD. Analysis and Forecast

On Monday, intraday declines pushed gold prices below the 3365 level, but oscillators on the daily chart have not yet started to gain negative momentum. This suggests that the precious

Irina Yanina 19:34 2025-08-11 UTC+2

Trading Signals for EUR/USD for August 11-15, 2025: sell below 1.1650 (200 EMA - 7/8 Murray)

Early in the American session, the euro is trading around 1.1590. After a failed breakout of the downtrend channel, EUR/USD fell below the 21 SMA and below the 7/8 Murray

Dimitrios Zappas 17:54 2025-08-11 UTC+2

Trading Signals for GOLD (XAU/USD) for August 11-15, 2025: sell below $3,380 or buy if rebound 3,341 (21 SMA - 7/8 Murray)

The eagle indicator is showing a negative signal, so we must be very cautious if we are buying, as the bearish force is likely to intensify in the coming hours

Dimitrios Zappas 17:51 2025-08-11 UTC+2

Forecast for EUR/USD on August 11, 2025

On Friday, EUR/USD made two rebounds from the 1.1637–1.1645 support zone and turned in favor of the euro. This means the upward movement could continue today toward the 76.4% Fibonacci

Samir Klishi 10:44 2025-08-11 UTC+2

Forecast for GBP/USD on August 11, 2025

On the hourly chart, GBP/USD on Friday made two rebounds from the 1.3425 level, and on Monday continues moving upward toward the 76.4% retracement level at 1.3470. A rebound from

Samir Klishi 10:25 2025-08-11 UTC+2

Forex forecast 11/08/2025: EUR/USD, USD/JPY, GBP/USD, Gold, Ethereum and Bitcoin

Useful links: My other articles are available in this section InstaForex course for beginners Popular Analytics Open trading account Important: The begginers in forex trading need to be very careful

Sebastian Seliga 10:20 2025-08-11 UTC+2

GBP/USD. Technical Analysis for the Week of August 11–16

Trend Analysis This week, from the 1.3450 level (close to the last weekly candle), the price may start moving downward toward 1.3270 – a historical support level (blue dotted line)

Stefan Doll 10:02 2025-08-11 UTC+2

EUR/USD. Technical Analysis for the Week of August 11–16

Last week, the pair moved upward, almost testing the historical resistance level at 1.1710 (blue dotted line), and then turned downward, closing the weekly candle at 1.1641. In the coming

Stefan Doll 09:55 2025-08-11 UTC+2

GBP/USD. Indicator Analysis on August 11, 2025

On Friday, the pair moved downward, tested the 61.8% retracement level at 1.3416 (red dotted line), and then rose, closing the daily candle at 1.3450. Today, the price will attempt

Stefan Doll 09:53 2025-08-11 UTC+2

EUR/USD. Indicator Analysis on August 11, 2025

On Friday, the pair moved downward, almost testing the 23.6% retracement level at 1.1626 (blue dotted line), after which the price rose slightly and closed the daily candle at 1.1641

Stefan Doll 09:40 2025-08-11 UTC+2
Can't speak right now?
Ask your question in the chat.
 

Dear visitor,

Your IP address shows that you are currently located in the USA. If you are a resident of the United States, you are prohibited from using the services of InstaFintech Group including online trading, online transfers, deposit/withdrawal of funds, etc.

If you think you are seeing this message by mistake and your location is not the US, kindly proceed to the website. Otherwise, you must leave the website in order to comply with government restrictions.

Why does your IP address show your location as the USA?

  • - you are using a VPN provided by a hosting company based in the United States;
  • - your IP does not have proper WHOIS records;
  • - an error occurred in the WHOIS geolocation database.

Please confirm whether you are a US resident or not by clicking the relevant button below. If you choose the wrong option, being a US resident, you will not be able to open an account with InstaTrade anyway.

We are sorry for any inconvenience caused by this message.