empty
10.12.2024 04:51 PM
Weekly Forecast Using Simplified Wave Analysis for EUR/USD, USD/JPY, GBP/JPY, USD/CAD, NZD/USD, and Gold as of December 10

EUR/USD

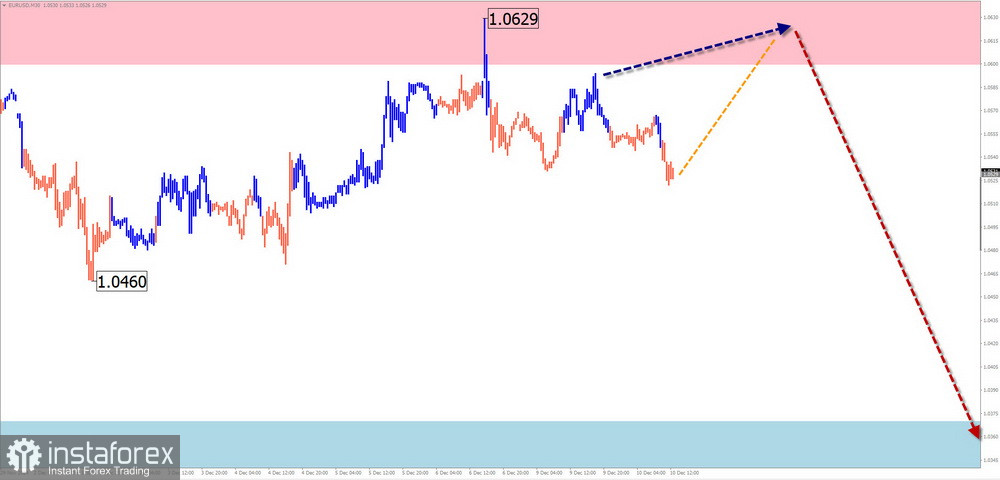
Analysis:The bearish wave that began in August continues to develop. The bullish wave forming since late November remains corrective, with its level not exceeding the retracement of the prior trend segment. Last week, the price reached the calculated resistance zone.

Forecast:This week, the euro is expected to exhibit sideways movement. A retest of the calculated resistance zone is anticipated in the early days, with increased volatility and a return to bearish momentum expected by the end of the week.

This image is no longer relevant

Potential Reversal Zones:

  • Resistance: 1.0600/1.0650
  • Support: 1.0380/1.0330

Recommendations:

  • Selling: No trading conditions until reversal signals emerge near resistance.
  • Buying: Limited potential purchases may result in losses.

USD/JPY

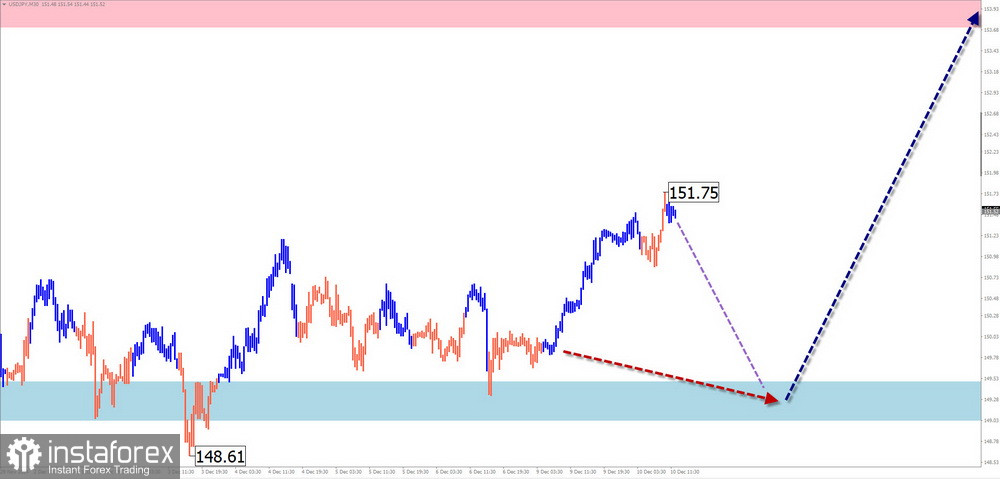
Analysis:The short-term trend is guided by an ongoing upward extended flat wave. The downward movement since early October is a correction of the previous upward trend and is nearing completion.

Forecast:The current decline is expected to conclude this week, with a reversal forming in the calculated support zone and a subsequent upward price movement. Calculated zones provide a potential weekly range for the pair's movement.

This image is no longer relevant

Potential Reversal Zones:

  • Resistance: 153.70/154.20
  • Support: 149.50/149.00

Recommendations:

  • Buying: Can be entered fractionally after reversal signals appear.
  • Selling: Possible intraday with reduced volume sizes, considering the limited downward potential.

GBP/JPY

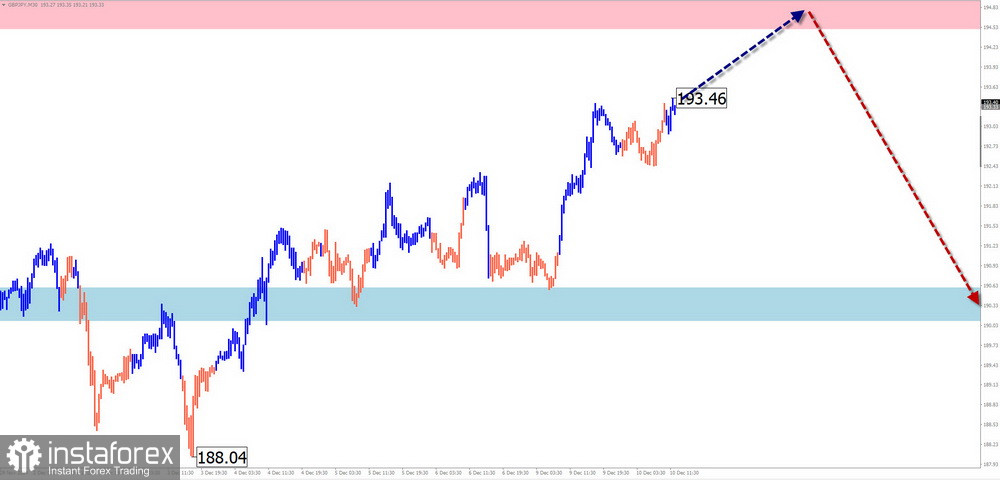
Analysis:The ongoing upward trend in the pound-yen cross began in August. Over the past two months, the pair has mostly moved sideways, forming a corrective extended flat wave (B), now nearing completion.

Forecast:The cross is expected to move upwards in the coming days, potentially reaching the calculated resistance zone. A subsequent decline may follow, limited to the support zone boundaries.

This image is no longer relevant

Potential Reversal Zones:

  • Resistance: 194.50/195.00
  • Support: 190.60/190.10

Recommendations:

  • Selling: Premature before the current wave completes and may result in losses.
  • Buying: Acceptable during individual trading sessions with fractional volume sizes.

USD/CAD

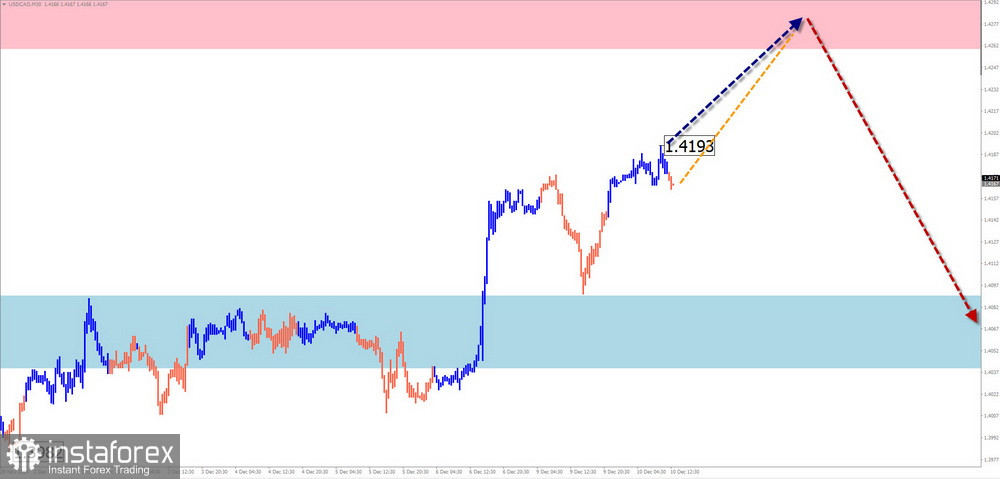
Analysis:The short-term bullish wave since September 25 continues to guide the pair. The price has reached the lower boundary of a strong reversal zone. The wave structure appears complete, but no imminent reversal signals are visible on the chart.

Forecast:After potential pressure on the resistance zone early in the week, a reversal and the start of a downward trend are expected. A brief breach of the reversal zone's upper boundary is possible before the direction changes.

This image is no longer relevant

Potential Reversal Zones:

  • Resistance: 1.4260/1.4310
  • Support: 1.4090/1.4040

Recommendations:

  • Buying: Possible with reduced volume sizes during individual trading sessions.
  • Selling: Consider fractionally after confirmed reversal signals in the resistance zone.

NZD/USD

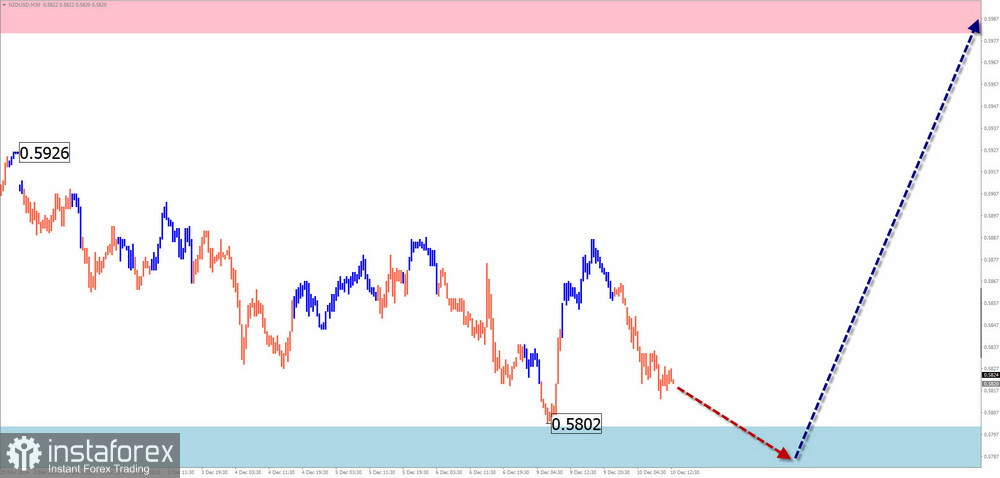
Analysis:The short-term trend for the New Zealand dollar has been guided by a bearish wave since September. By late November, prices reached a strong reversal zone. While the wave structure appears complete, no definitive reversal signals are present on the chart.

Weekly Forecast:The pair is expected to move within a channel defined by the nearest reversal zones. Initial pressure on the support zone may occur, with a directional shift and retracement toward resistance likely by the end of the week or early next week.

This image is no longer relevant

Potential Reversal Zones:

  • Resistance: 0.5980/0.6030
  • Support: 0.5800/0.5750

Recommendations:

  • Buying: Possible intraday with fractional volume sizes but limited potential.
  • Selling: Not advisable until confirmed reversal signals appear near resistance.

Gold

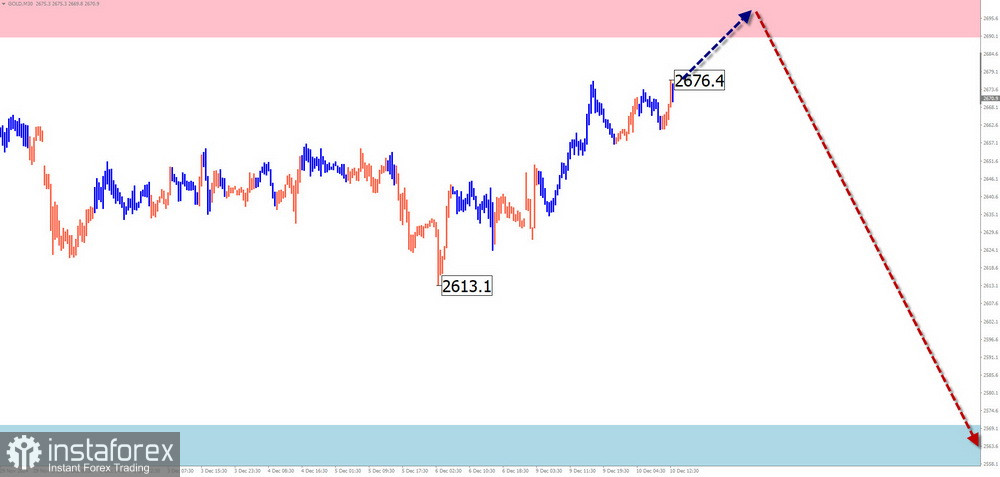
Analysis:After peaking in late October, gold prices have been correcting downward. The analysis of the corrective wave indicates the absence of a concluding (C) segment. The lower boundary of a strong reversal zone coincides with the calculated resistance area.

Forecast:In the next couple of days, a retest of the resistance zone is likely. Subsequently, a directional shift toward the calculated support zone is expected, with the highest volatility anticipated later in the week.

This image is no longer relevant

Potential Reversal Zones:

  • Resistance: 2690.0/2710.0
  • Support: 2570.0/2550.0

Recommendations:

  • Buying: Limited potential and high risk.
  • Selling: Suitable for short-term trading during individual sessions, contingent on reversal signals near resistance.

Explanation of Simplified Wave Analysis (SWA):

  • All waves consist of three parts (A-B-C).
  • Only the latest, incomplete wave is analyzed for each timeframe.
  • Dotted lines indicate expected movements.

Attention: The wave algorithm does not account for the duration of price movements over time.

Isabel Clark,
Analytical expert of InstaTrade
© 2007-2025

Recommended Stories

EUR/USD Analysis on August 12, 2025

The wave structure on the 4-hour chart for EUR/USD has remained unchanged for several months, which is very encouraging. Even when corrective waves form, the structure's integrity is preserved, allowing

Chin Zhao 20:40 2025-08-12 UTC+2

GBP/USD Analysis on August 12, 2025

For GBP/USD, the wave structure continues to indicate the formation of a bullish impulse wave pattern. The wave picture is almost identical to that of EUR/USD, as the only "culprit"

Chin Zhao 20:18 2025-08-12 UTC+2

GBP/USD Analysis on August 11, 2025

The wave pattern for GBP/USD continues to indicate the formation of an upward impulsive wave structure. The wave picture is almost identical to that of EUR/USD, as the only "driving

Chin Zhao 20:43 2025-08-11 UTC+2

EUR/USD Analysis on August 11, 2025

The wave pattern on the 4-hour chart for EUR/USD has remained unchanged for several months, which is a positive sign. Even during the formation of corrective waves, the integrity

Chin Zhao 19:41 2025-08-11 UTC+2

EUR/USD Analysis on August 8, 2025

The wave pattern on the EUR/USD 4-hour chart has remained unchanged for several months, which is a very positive sign. Even when corrective waves are forming, the integrity

Chin Zhao 20:59 2025-08-08 UTC+2

GBP/USD Analysis on August 7, 2025

The wave pattern for GBP/USD continues to indicate the formation of an upward impulsive wave pattern. The wave picture is nearly identical to that of EUR/USD, since the only "main

Chin Zhao 20:18 2025-08-07 UTC+2

EUR/USD Analysis on August 7, 2025

The wave pattern on the 4-hour EUR/USD chart has remained unchanged for several months, which is very encouraging. Even when corrective waves are forming, the overall structure stays intact. This

Chin Zhao 20:14 2025-08-07 UTC+2

GBP/USD Analysis on August 6, 2025

The wave pattern for GBP/USD continues to indicate the development of a bullish impulse structure. The wave configuration is almost identical to that of EUR/USD, as the only real driver

Chin Zhao 21:55 2025-08-06 UTC+2

EUR/USD Analysis on August 6, 2025

The wave pattern on the 4-hour chart for the EUR/USD instrument has remained unchanged for several months, which is quite encouraging. Even during the formation of corrective waves, the structure

Chin Zhao 21:51 2025-08-06 UTC+2

GBP/USD Analysis on August 4, 2025

The wave pattern for the GBP/USD pair continues to indicate the formation of an upward impulsive wave structure. The wave picture closely resembles that of EUR/USD, as the sole "driver"

Chin Zhao 22:02 2025-08-04 UTC+2
Can't speak right now?
Ask your question in the chat.
 

Dear visitor,

Your IP address shows that you are currently located in the USA. If you are a resident of the United States, you are prohibited from using the services of InstaFintech Group including online trading, online transfers, deposit/withdrawal of funds, etc.

If you think you are seeing this message by mistake and your location is not the US, kindly proceed to the website. Otherwise, you must leave the website in order to comply with government restrictions.

Why does your IP address show your location as the USA?

  • - you are using a VPN provided by a hosting company based in the United States;
  • - your IP does not have proper WHOIS records;
  • - an error occurred in the WHOIS geolocation database.

Please confirm whether you are a US resident or not by clicking the relevant button below. If you choose the wrong option, being a US resident, you will not be able to open an account with InstaTrade anyway.

We are sorry for any inconvenience caused by this message.