See also

 24.03.2025 07:08 AM
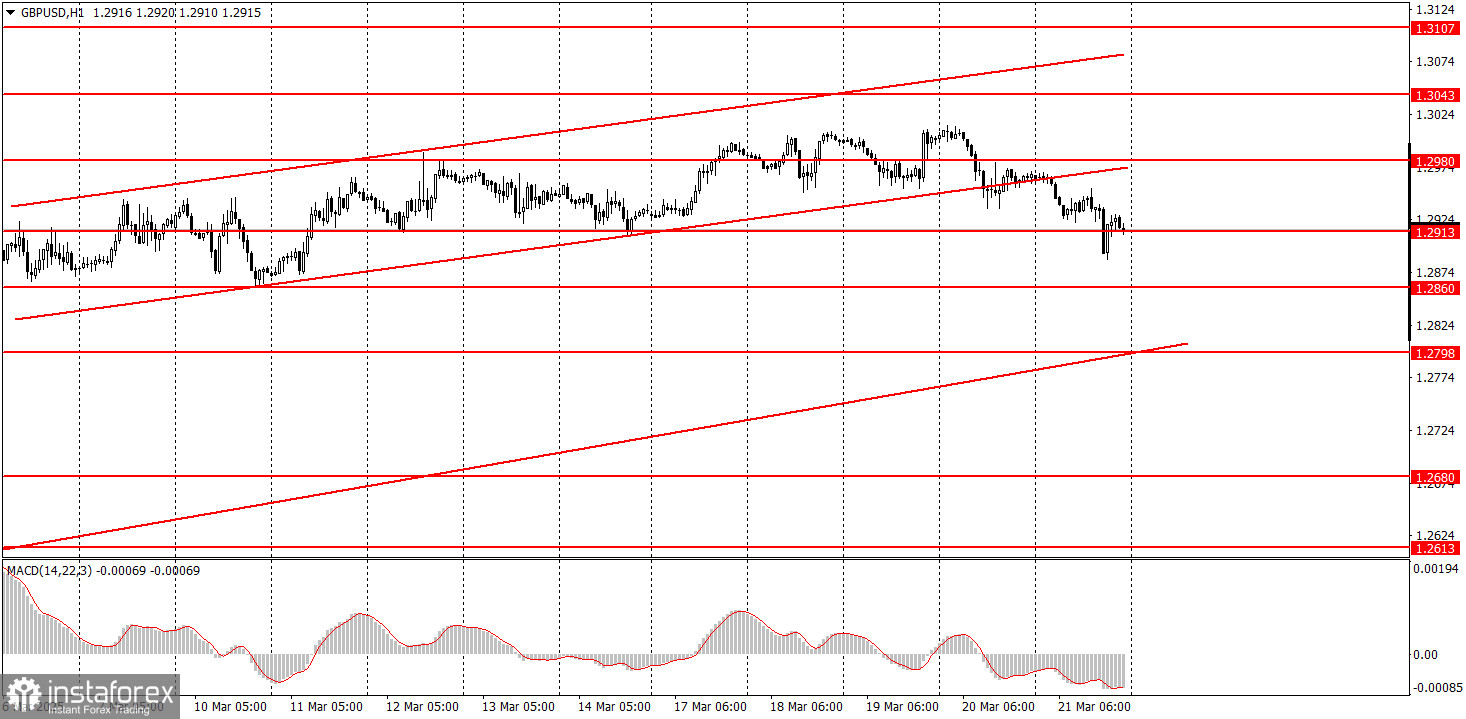
The GBP/USD pair continued its downward movement on Friday, which was fully justified by both the technical picture and the prevailing market situation. As a reminder, the dollar had been falling for a prolonged period, driven solely by one factor — Donald Trump's protectionist policies. All other factors were largely ignored. However, on Wednesday evening, it became clear that in light of recent developments, the Federal Reserve has no intention of aggressively cutting interest rates and still plans no more than two rate cuts — exactly as it had outlined last year. Moreover, the Fed currently sees no issues with the U.S. economy. As such, the U.S. dollar had fallen too sharply and for too long without any solid justification. Therefore, the current decline in the pair is entirely logical, at least as part of a corrective movement. Of course, expecting the resumption of the broader 6-month and 16-year downtrends in the near term may be overly optimistic, but those trends remain in place.
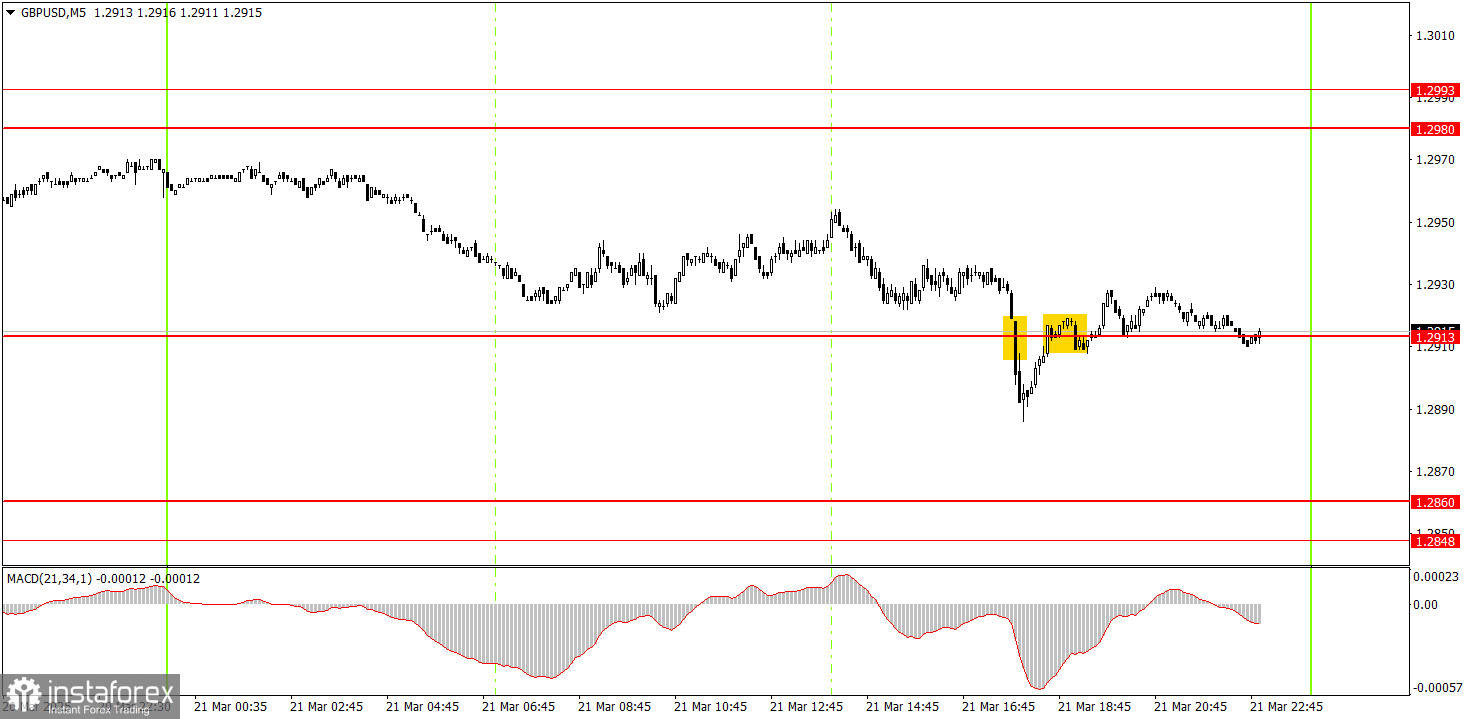
Two trading signals were formed on Friday on the 5-minute timeframe, but there was little point in acting on them. First, the day's volatility was low. Second, both signals emerged just a few hours before the market closed. If these had been strong, unambiguous signals, there might have been reason to act on them. But that was not the case.
On the hourly timeframe, the GBP/USD pair should have started a downtrend long ago, but Trump keeps preventing that from happening. We still expect the pound to fall toward the 1.1800 level in the medium term, although it's unclear how long the dollar's "Trump-driven" decline will last. Once this movement ends, the technical picture could change dramatically in all timeframes, but the long-term trend still points downward. The British pound has not risen without reason, but once again it has rallied too strongly and irrationally.
The technical setup on the hourly chart suggests that the GBP/USD pair could continue to decline on Monday. The pound is once again overbought and unjustifiably expensive.
On the 5-minute chart, the relevant levels for trading are: 1.2301, 1.2372–1.2387, 1.2445, 1.2502–1.2508, 1.2547, 1.2613, 1.2680–1.2685, 1.2723, 1.2791–1.2798, 1.2848–1.2860, 1.2913, 1.2980–1.2993, 1.3043, 1.3102–1.3107. The UK and the U.S. will publish services and manufacturing PMI data on Monday. These are relatively meaningful reports but are more likely to affect market sentiment locally rather than broadly.
Support and Resistance Levels: These are target levels for opening or closing positions and can also serve as points for placing Take Profit orders.
Red Lines: Channels or trendlines indicating the current trend and the preferred direction for trading.
MACD Indicator (14,22,3): A histogram and signal line used as a supplementary source of trading signals.
Important Events and Reports: Found in the economic calendar, these can heavily influence price movements. Exercise caution or exit the market during their release to avoid sharp reversals.
Forex trading beginners should remember that not every trade will be profitable. Developing a clear strategy and practicing proper money management are essential for long-term trading success.


