empty
03.04.2025 05:07 AM
EUR/USD Forecast for April 3, 2025

Starting today, U.S. tariffs ranging from 10% to 50% will apply to nearly all of America's trading partners. Market participants were prepared and refrained from panic, although equity indices weakened. In response, efforts to strengthen regional and global trade alliances have regained momentum. We immediately heard renewed focus on BRICS, ASEAN, APEC, and others. China, Japan, and South Korea announced the formation of a new trade bloc.

This image is no longer relevant

Meanwhile, markets are still evaluating losses and opportunities. Against this backdrop, investors have begun to move away from the U.S. dollar, technically triggering upward moves in anti-dollar currencies.

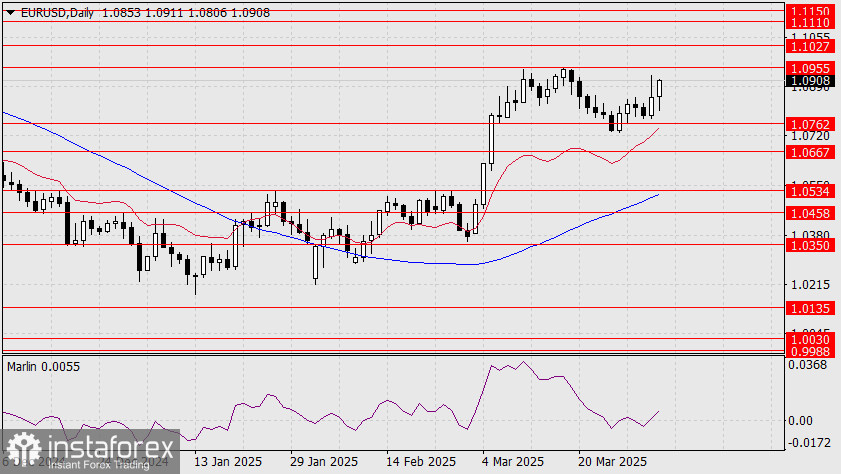
On the daily EUR/USD chart, the euro is approaching the first target level at 1.0955. The next targets are 1.1027 and the broader target range of 1.1110/50. The Marlin oscillator has moved into positive territory with significant upside potential.

This image is no longer relevant

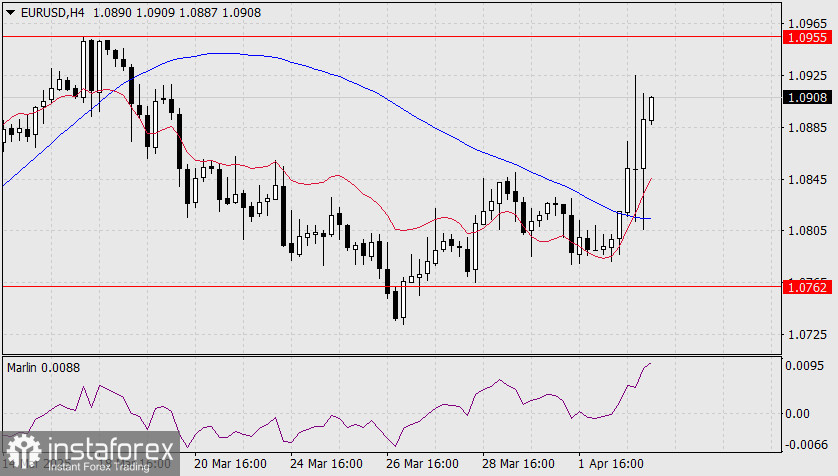
On the H4 chart, yesterday evening's price showed a wide range—over 100 pips—directly above the MACD line, which currently reinforces that line and signals a strong short-term uptrend. This trend could only be broken if the price falls below the support level at 1.0762. In that case, the 1.0667 target would come into play.

Laurie Bailey,
Analytical expert of InstaTrade
© 2007-2025

Recommended Stories

XAU/USD. Analysis and Forecast

On Monday, intraday declines pushed gold prices below the 3365 level, but oscillators on the daily chart have not yet started to gain negative momentum. This suggests that the precious

Irina Yanina 19:34 2025-08-11 UTC+2

Trading Signals for EUR/USD for August 11-15, 2025: sell below 1.1650 (200 EMA - 7/8 Murray)

Early in the American session, the euro is trading around 1.1590. After a failed breakout of the downtrend channel, EUR/USD fell below the 21 SMA and below the 7/8 Murray

Dimitrios Zappas 17:54 2025-08-11 UTC+2

Trading Signals for GOLD (XAU/USD) for August 11-15, 2025: sell below $3,380 or buy if rebound 3,341 (21 SMA - 7/8 Murray)

The eagle indicator is showing a negative signal, so we must be very cautious if we are buying, as the bearish force is likely to intensify in the coming hours

Dimitrios Zappas 17:51 2025-08-11 UTC+2

Forecast for EUR/USD on August 11, 2025

On Friday, EUR/USD made two rebounds from the 1.1637–1.1645 support zone and turned in favor of the euro. This means the upward movement could continue today toward the 76.4% Fibonacci

Samir Klishi 10:44 2025-08-11 UTC+2

Forecast for GBP/USD on August 11, 2025

On the hourly chart, GBP/USD on Friday made two rebounds from the 1.3425 level, and on Monday continues moving upward toward the 76.4% retracement level at 1.3470. A rebound from

Samir Klishi 10:25 2025-08-11 UTC+2

Forex forecast 11/08/2025: EUR/USD, USD/JPY, GBP/USD, Gold, Ethereum and Bitcoin

Useful links: My other articles are available in this section InstaForex course for beginners Popular Analytics Open trading account Important: The begginers in forex trading need to be very careful

Sebastian Seliga 10:20 2025-08-11 UTC+2

GBP/USD. Technical Analysis for the Week of August 11–16

Trend Analysis This week, from the 1.3450 level (close to the last weekly candle), the price may start moving downward toward 1.3270 – a historical support level (blue dotted line)

Stefan Doll 10:02 2025-08-11 UTC+2

EUR/USD. Technical Analysis for the Week of August 11–16

Last week, the pair moved upward, almost testing the historical resistance level at 1.1710 (blue dotted line), and then turned downward, closing the weekly candle at 1.1641. In the coming

Stefan Doll 09:55 2025-08-11 UTC+2

GBP/USD. Indicator Analysis on August 11, 2025

On Friday, the pair moved downward, tested the 61.8% retracement level at 1.3416 (red dotted line), and then rose, closing the daily candle at 1.3450. Today, the price will attempt

Stefan Doll 09:53 2025-08-11 UTC+2

EUR/USD. Indicator Analysis on August 11, 2025

On Friday, the pair moved downward, almost testing the 23.6% retracement level at 1.1626 (blue dotted line), after which the price rose slightly and closed the daily candle at 1.1641

Stefan Doll 09:40 2025-08-11 UTC+2
Can't speak right now?
Ask your question in the chat.
 

Dear visitor,

Your IP address shows that you are currently located in the USA. If you are a resident of the United States, you are prohibited from using the services of InstaFintech Group including online trading, online transfers, deposit/withdrawal of funds, etc.

If you think you are seeing this message by mistake and your location is not the US, kindly proceed to the website. Otherwise, you must leave the website in order to comply with government restrictions.

Why does your IP address show your location as the USA?

  • - you are using a VPN provided by a hosting company based in the United States;
  • - your IP does not have proper WHOIS records;
  • - an error occurred in the WHOIS geolocation database.

Please confirm whether you are a US resident or not by clicking the relevant button below. If you choose the wrong option, being a US resident, you will not be able to open an account with InstaTrade anyway.

We are sorry for any inconvenience caused by this message.