empty
14.04.2025 12:25 PM
Forecast for GBP/USD on April 14, 2025

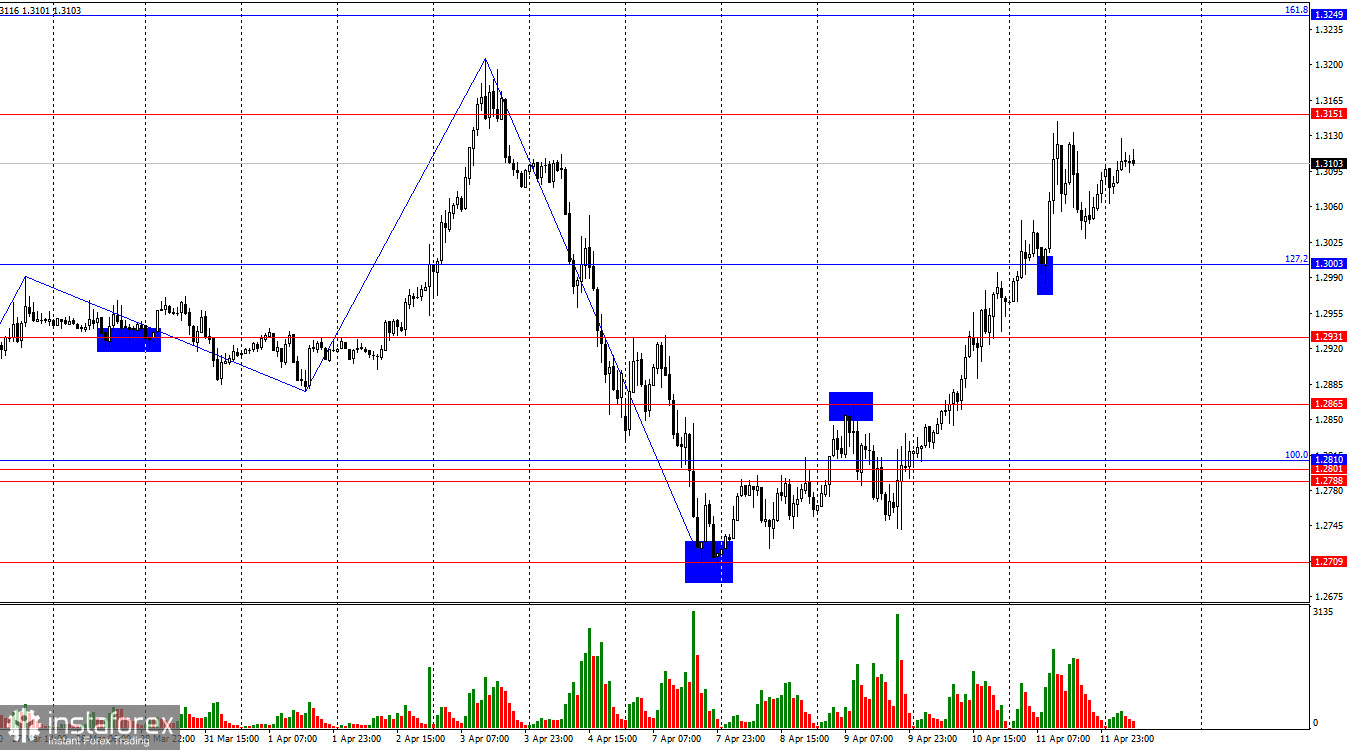
On the hourly chart, the GBP/USD pair continued its upward movement on Friday and today is on track to reach the 1.3151 level. A bounce from this level will favor the US dollar and a possible decline toward the 127.2% Fibonacci level at 1.3003. A firm break above 1.3151 will increase the likelihood of continued growth toward the next corrective level at 1.3249.

This image is no longer relevant

The last completed upward wave broke the previous high, while the new downward wave easily broke the last low. This could suggest that the trend is shifting to bearish. However, considering recent events, the strength of movements, and the frequency of trend changes, I wouldn't rush to such conclusions. In my view, market sentiment may shift multiple times. Everything depends on the progression of the trade war.

The news on Friday was still disastrous for the dollar, and even on Monday, we're seeing the same picture as before – the dollar remains under strong market pressure. None of Donald Trump's concessions had any positive effect on the US currency. Trump announced a 90-day pause, which could have supported the dollar. But traders understand this is not a true "amnesty" – tariffs are still in effect, and the US President merely removed the likelihood of further increases for the next three months. Where's the positive in that?

On Friday, Trump excluded phones, computers, and various electronic devices from the list of Chinese imports subject to tariffs. But what does that matter if just recently he raised overall tariffs to 145%? This time, the market didn't fall into a false sense of optimism. It now looks at events without rose-colored glasses.

This image is no longer relevant

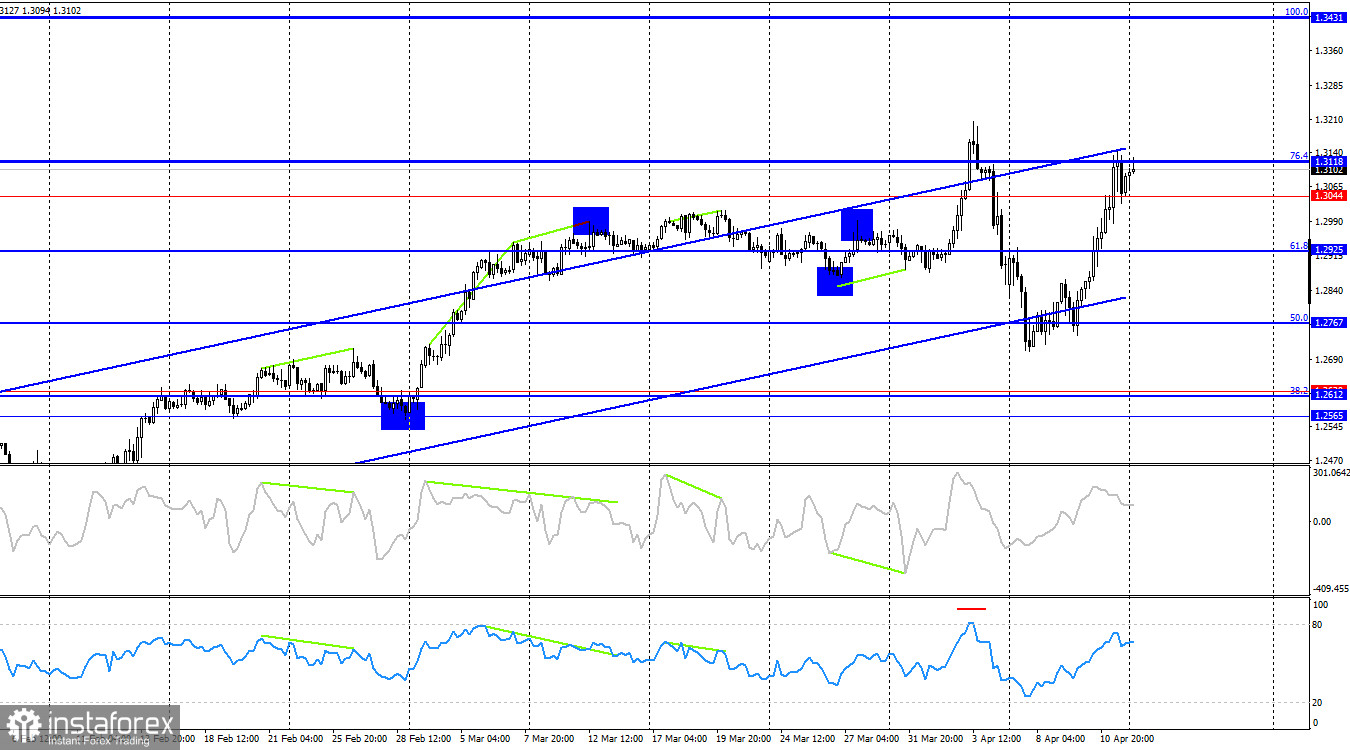
On the 4-hour chart, the pair retains its bullish trend. In the near term, even a break below the ascending channel wouldn't convince me that the trend has reversed. The trade war continues to escalate, and in recent months this has only led to the dollar's decline. Either way, chart analysis cannot currently answer the question of what to expect next – it is the news backdrop that dictates market movements.

Commitments of Traders (COT) Report:

This image is no longer relevant

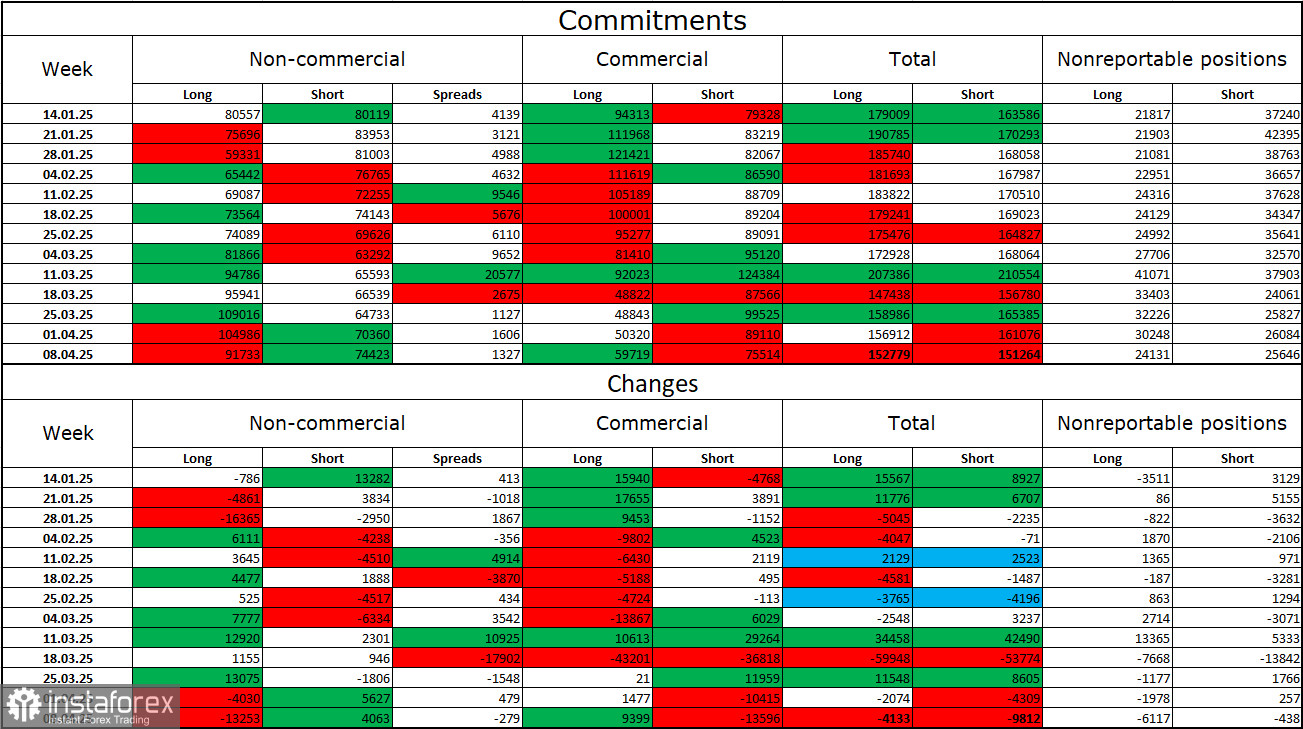
The sentiment among the "Non-commercial" trader category became less bullish last week. The number of long positions held by speculators decreased by 13,253, while the number of short positions rose by 4,067.

Bears have lost their edge in the market. The gap between long and short positions now stands at 18,000 in favor of bulls: 92,000 vs. 74,000.

In my view, the pound still faces downside risks, but recent developments may cause a longer-term market reversal. Over the past three months, long positions have increased from 80,000 to 92,000, while short positions have decreased from 80,000 to 74,000. More notably, over the last 10 weeks, longs rose from 59,000 to 92,000, and shorts fell from 81,000 to 74,000. Let me remind you – these are the "10 weeks of Trump's reign"...

News Calendar for the US and the UK:

Monday's economic calendar contains no significant entries. Thus, market sentiment today will continue to be driven by the overall news backdrop. Any updates on the trade war will have an impact, should they emerge.

GBP/USD Forecast and Trader Tips:

Selling the pair is possible today if it rebounds from 1.3151, with a target of 1.3003. Buying was possible after the pair closed above 1.2810 on the hourly chart, with targets of 1.2865 and 1.2931 – all of which have been reached. Positions could have been held above 1.3003 with a target of 1.3151 – which is also nearly achieved.

Fibonacci levels are drawn from 1.2809–1.2100 on the hourly chart and from 1.3431–1.2104 on the 4-hour chart.

Samir Klishi,
Analytical expert of InstaTrade
© 2007-2025

Recommended Stories

XAU/USD. Analysis and Forecast

On Monday, intraday declines pushed gold prices below the 3365 level, but oscillators on the daily chart have not yet started to gain negative momentum. This suggests that the precious

Irina Yanina 19:34 2025-08-11 UTC+2

Trading Signals for EUR/USD for August 11-15, 2025: sell below 1.1650 (200 EMA - 7/8 Murray)

Early in the American session, the euro is trading around 1.1590. After a failed breakout of the downtrend channel, EUR/USD fell below the 21 SMA and below the 7/8 Murray

Dimitrios Zappas 17:54 2025-08-11 UTC+2

Trading Signals for GOLD (XAU/USD) for August 11-15, 2025: sell below $3,380 or buy if rebound 3,341 (21 SMA - 7/8 Murray)

The eagle indicator is showing a negative signal, so we must be very cautious if we are buying, as the bearish force is likely to intensify in the coming hours

Dimitrios Zappas 17:51 2025-08-11 UTC+2

Forecast for EUR/USD on August 11, 2025

On Friday, EUR/USD made two rebounds from the 1.1637–1.1645 support zone and turned in favor of the euro. This means the upward movement could continue today toward the 76.4% Fibonacci

Samir Klishi 10:44 2025-08-11 UTC+2

Forecast for GBP/USD on August 11, 2025

On the hourly chart, GBP/USD on Friday made two rebounds from the 1.3425 level, and on Monday continues moving upward toward the 76.4% retracement level at 1.3470. A rebound from

Samir Klishi 10:25 2025-08-11 UTC+2

Forex forecast 11/08/2025: EUR/USD, USD/JPY, GBP/USD, Gold, Ethereum and Bitcoin

Useful links: My other articles are available in this section InstaForex course for beginners Popular Analytics Open trading account Important: The begginers in forex trading need to be very careful

Sebastian Seliga 10:20 2025-08-11 UTC+2

GBP/USD. Technical Analysis for the Week of August 11–16

Trend Analysis This week, from the 1.3450 level (close to the last weekly candle), the price may start moving downward toward 1.3270 – a historical support level (blue dotted line)

Stefan Doll 10:02 2025-08-11 UTC+2

EUR/USD. Technical Analysis for the Week of August 11–16

Last week, the pair moved upward, almost testing the historical resistance level at 1.1710 (blue dotted line), and then turned downward, closing the weekly candle at 1.1641. In the coming

Stefan Doll 09:55 2025-08-11 UTC+2

GBP/USD. Indicator Analysis on August 11, 2025

On Friday, the pair moved downward, tested the 61.8% retracement level at 1.3416 (red dotted line), and then rose, closing the daily candle at 1.3450. Today, the price will attempt

Stefan Doll 09:53 2025-08-11 UTC+2

EUR/USD. Indicator Analysis on August 11, 2025

On Friday, the pair moved downward, almost testing the 23.6% retracement level at 1.1626 (blue dotted line), after which the price rose slightly and closed the daily candle at 1.1641

Stefan Doll 09:40 2025-08-11 UTC+2
Can't speak right now?
Ask your question in the chat.
 

Dear visitor,

Your IP address shows that you are currently located in the USA. If you are a resident of the United States, you are prohibited from using the services of InstaFintech Group including online trading, online transfers, deposit/withdrawal of funds, etc.

If you think you are seeing this message by mistake and your location is not the US, kindly proceed to the website. Otherwise, you must leave the website in order to comply with government restrictions.

Why does your IP address show your location as the USA?

  • - you are using a VPN provided by a hosting company based in the United States;
  • - your IP does not have proper WHOIS records;
  • - an error occurred in the WHOIS geolocation database.

Please confirm whether you are a US resident or not by clicking the relevant button below. If you choose the wrong option, being a US resident, you will not be able to open an account with InstaTrade anyway.

We are sorry for any inconvenience caused by this message.