
See also


 05.11.2026 06:15 AM
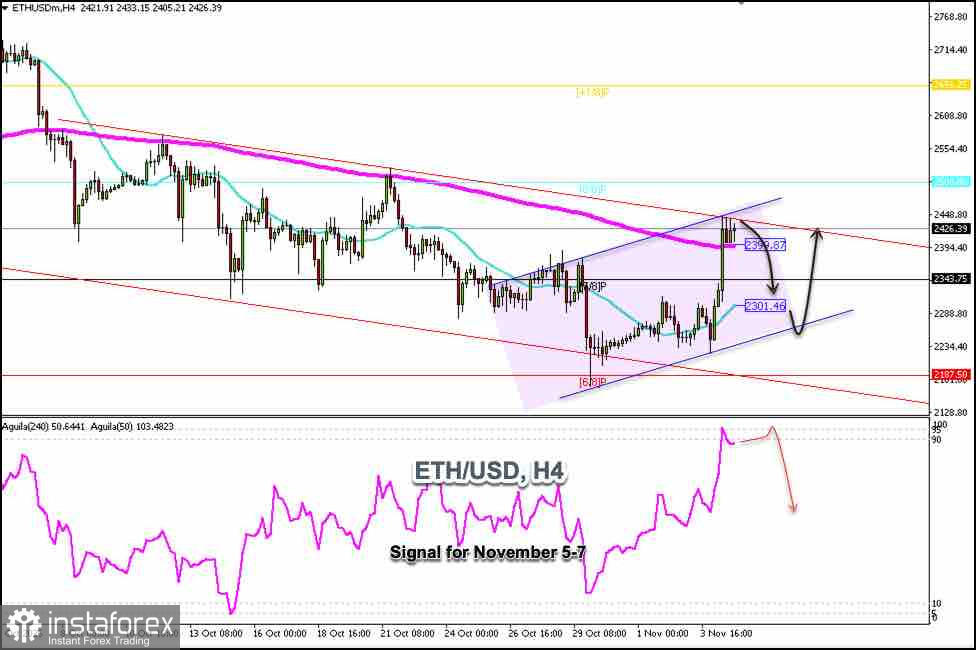
Ethereum is trading around $2,426 within the downtrend channel that has been forming since early October, above both the 200-day and 21-day moving averages, with a positive bias, although it may be approaching overbought levels.
During the US trading session on Wednesday, November 3, Ethereum developed a strong bullish rally after hitting a low of $2,200, reaching the $2,450 range.
On the H4 chart, we can see that Ethereum has encountered strong resistance at the upper band of the downtrend channel. Therefore, we believe a technical correction could occur in the coming days, with a possible pullback toward the 21-day simple moving average (SMA) at $2,301.
If Ethereum decisively breaks out of the downtrend channel in the coming hours and consolidates above $2,450, the strong uptrend could continue and reach the psychological level of $2,500, around the Murray 8/8 level.
From a technical perspective, we believe Ethereum could face strong resistance around $2,500, so we should closely monitor current price levels; if the price reaches this zone, it could be considered an opportunity to open short positions.
If, in the coming hours, Ethereum consolidates below the 200-period exponential moving average (EMA), this could be considered a sell signal, with targets at the Murray 7/8 level and the 21-period simple moving average (SMA), around $2,300.
The Eagle indicator is showing signs of overbought conditions, so from a technical standpoint, a technical correction could be expected in the coming days.
You have already liked this post today
*The market analysis posted here is meant to increase your awareness, but not to give instructions to make a trade.


