See also

 31.03.2026 04:01 AM
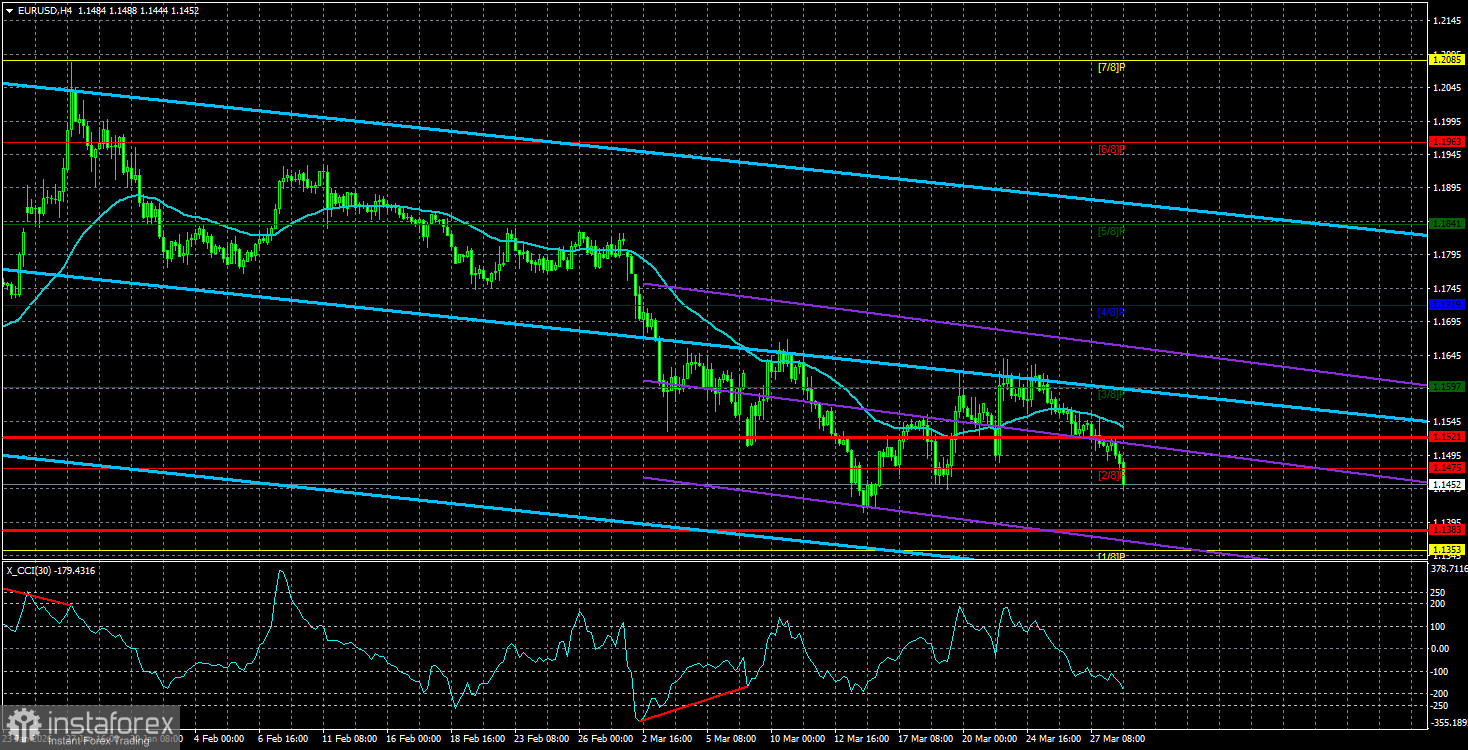
The EUR/USD currency pair has continued its lethargic downward movement. It seems the market responds daily to Donald Trump's statements that the end of the war in the Middle East is near, that America will achieve all its goals, capture all the oil in the region, and that Tehran is ready to accept any terms of the agreement just to end the war. If anyone didn't get it, this is sarcasm. If the US dollar is strengthening, it means the market is still only expecting one thing – an escalation of the conflict. Otherwise, risk-averse sentiments would have diminished, and investors would have begun seeking more favorable refuges for their capital than the dollar.
In recent days, Trump has made numerous "important" statements that Iran continues to stubbornly reject and deny. According to Trump, Iran has agreed to accept most of the 15-point agreement. Therefore, Washington is considering asking for a few more points. Meanwhile, Iran has stated that it has not given any consent to "Trump's plan" and has instead put forward its own five conditions. Iran's five conditions seem quite logical and transparent, unlike Trump's 15 ultimatums that no one knows anything about. Iran wants reparations, payment for foreign ships passing through the Strait of Hormuz, and the lifting of sanctions. Otherwise, the war will continue, and the Strait of Hormuz will remain blocked. Incidentally, Yemen officially entered the war today, launching several strikes against Israel. Let's remember that Yemen has previously threatened to block the Bab al-Mandab Strait, which would surely drive oil prices to $150-200 per barrel.
Thus, we believe the trump cards are in Iran's hands, while Trump has only a couple of mediocre cards he is desperately trying to bluff with. Just yesterday, the US president stated that if Iran refuses the proposed terms, America will completely destroy Iranian power plants, oil fields, Kharg Island, and desalination plants. Can such a statement frighten Iran? In our opinion, no. Not all power plants can be destroyed, and Iran will respond with strikes against American bases and allies in the region, while the Iranian government is currently earning three times more from oil exports than before the war.
Just a month ago, before the war, Iran was exporting about 1 million barrels per day at around $47 per barrel. Now it is exporting 1.5 million barrels per day at $124 per barrel. Therefore, Iran, as strange as it may sound, is not losing from this war. Iran, possessing not only vast oil reserves but also control over the Strait of Hormuz, can now dictate its terms to the whole world. Want to fight? Fine, you will pay 2-3-4 times as much for oil and gas as before the war. And with the money earned from oil sales, Iran will then calmly restore all the destroyed infrastructure. However, it is unlikely that Trump will simply back down and recognize his defeat in the Middle East. Most likely, a ground offensive, at least on Khark Island, will still happen.
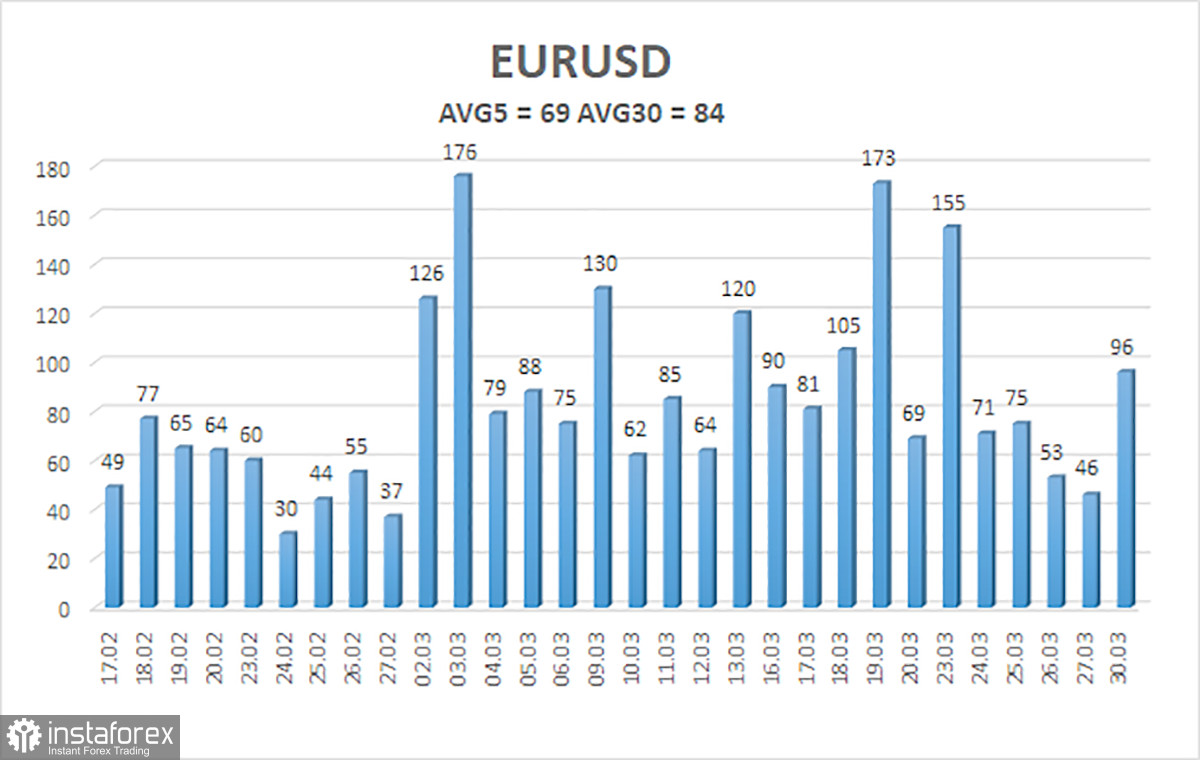
The average volatility of the EUR/USD currency pair over the past five trading days as of March 31 is 69 pips, which is considered "average." We expect the pair to trade between 1.1383 and 1.1521 on Tuesday. The upper channel of the linear regression has turned down, indicating a trend change. The CCI indicator has entered the oversold area and formed a "bullish" divergence, which again warns of the end of the downward trend. But geopolitics continues to pull the pair to the bottom.
The EUR/USD pair continues its downward movement, prompted by geopolitics. The global fundamental backdrop for the dollar remains extremely negative; however, for over a month now, the market has only been paying attention to geopolitics, rendering all other factors practically irrelevant. When the price is below the moving average, short positions can be considered with targets at 1.1383 and 1.1353. Above the moving average line, long positions are relevant, with targets at 1.1963 and 1.2085, but such movement requires the geopolitical situation to stabilize somewhat.


