
See also


 30.07.2026 10:12 AM
Yesterday, equity indices posted sharp losses. The S&P 500 fell by 1.52%, and the Nasdaq 100 slid by 1.74%. The Dow Jones Industrial Average lost 2.19%.
The Nasdaq 100 closed in correction territory, dropping by about 1.8% and finishing the session more than 11% below its June peak, dragging the broader market lower. For much of Tuesday, the index hovered near the correction threshold but ultimately closed below it. The S&P 500 declined by 1.5%. WTI oil jumped by more than 7% to around $85/bbl after US President Donald Trump warned the US would deliver a severe strike on Iran.
Market nerves were stoked by the Fed. Although the FOMC formally left interest rates unchanged, the statement revealed a rare split: three of 12 officials voted to raise rates, underscoring rising concern about inflation within the Committee. Chair Kevin Warsh said tighter financial conditions in the bond market have already done part of the Fed's work, implying that markets have priced in some of the tightening via higher yields.
Economists reacted critically to Warsh's rhetoric. RSM said Warsh's emphasis on restraint, uncertainty, and volatility looks like an attempt to influence Fed policy and warned such tight language will not play well outside a small institutional audience. Renaissance Macro Research put it bluntly: Warsh has bought himself only a temporary reprieve — either incoming data must rescue his position, or a hike will be required as soon as September.
Retail behavior highlighted the stress: Tuesday saw the largest net retail equity selling since the COVID-19 crash, concentrated in memory-chip stocks. The eight most sold names accounted for total net outflows, implying net buying across the remainder of the market — a sign that panic was focused on a narrow but highly significant segment. Notably, some institutional players had positioned for the opposite outcome: while most traders expected a hold, a subset bet on an unexpected hike.
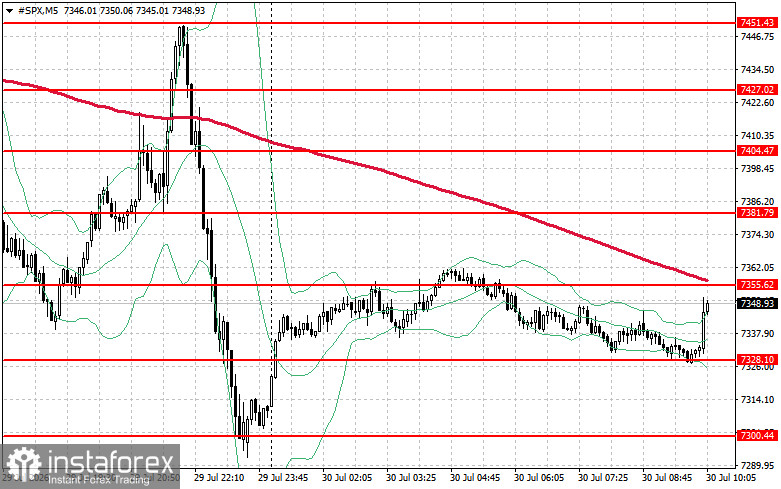
Technically, the daily S&P 500 chart suggests that the immediate task for buyers is to overcome the resistance level of $7,355. Doing so would support upside and open the path to $7,381. Holding above $7,404 would further strengthen buyers' positions. On the downside, buyers must defend $7,328. A break below that level would likely push the index back to $7,300 and open the way to $7,279.
You have already liked this post today
*The market analysis posted here is meant to increase your awareness, but not to give instructions to make a trade.


