
See also


 07.07.2026 12:54 AM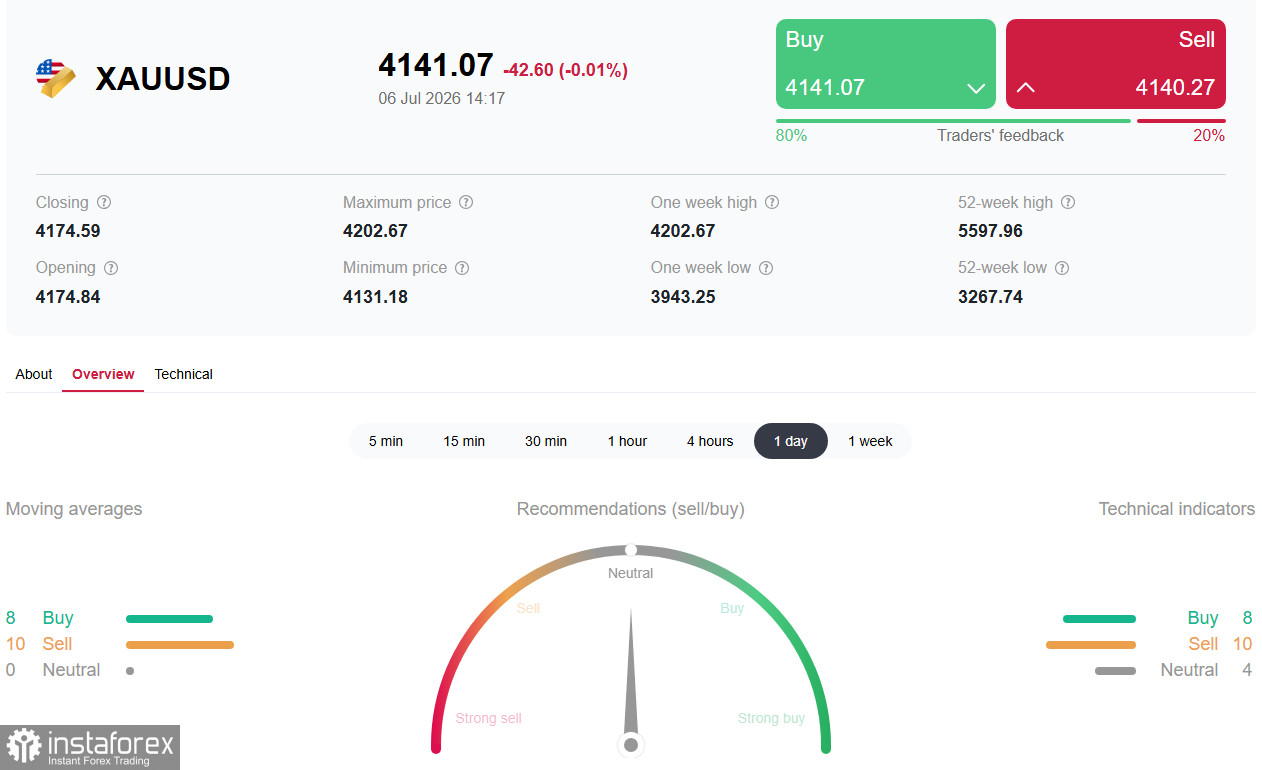
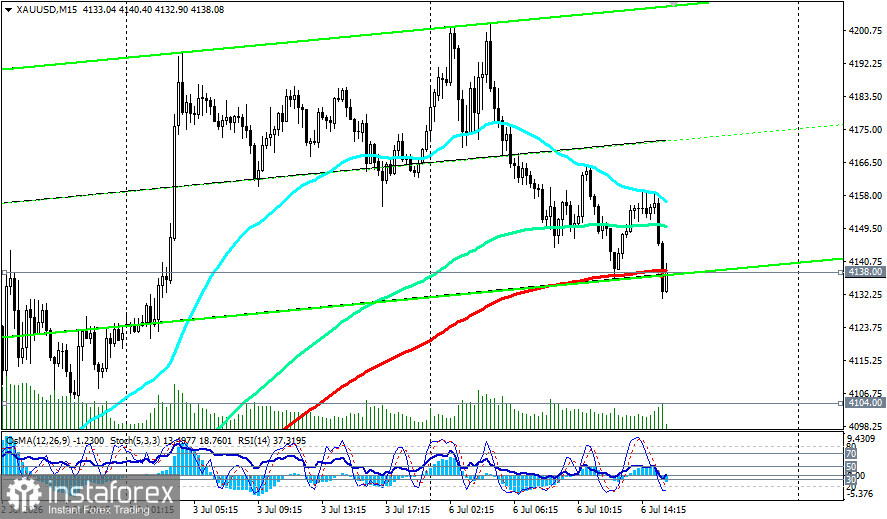
The main restraining factor for buyers has been the local strengthening of the U.S. dollar: the U.S. dollar index (USDX) rose by 0.20%, stabilizing near 100.80.
Fundamental Background: Structural Support Remains
Despite the short-term correction, the fundamental factors remain favorable for gold.
Central Banks Continue to Increase Reserves
According to data from the World Gold Council, central banks purchased 41 tons of gold in May, and a survey showed that nearly 90% of respondents expect an increase in gold reserves over the next year. China has increased its reserves for the 19th consecutive month, adding 320,000 ounces in May.
Institutional Demand Remains High
The European Central Bank's latest report confirmed that gold has officially surpassed U.S. Treasury bonds in global reserves. This reflects a long-term trend of diversifying reserves toward precious metals.
Monetary Policy of the Fed and Macroeconomic Statistics
Weak June data on non-farm employment in the U.S. (Nonfarm Payrolls), which showed an increase of only 57,000 jobs against a forecast of 110,000, indicated cooling in the U.S. economy. This led investors to lower expectations for an immediate rate hike by the Fed (the probability of a July move has dropped to 22%). However, according to the CME FedWatch tool, traders are still pricing in a 56% probability of policy tightening in September and about 77% by the end of 2026.
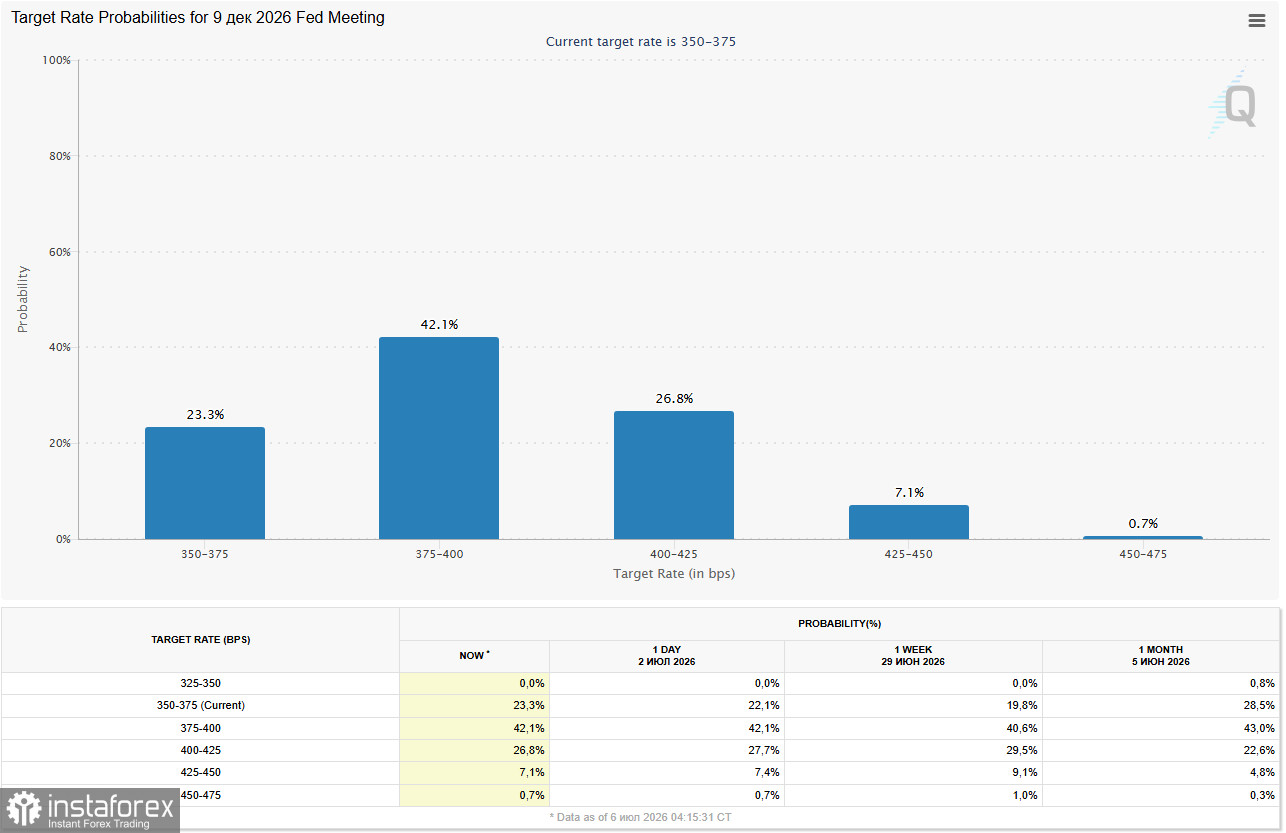
Expectations of a Prolonged Period of High Restrictive Rates Support Dollar Yields and Limit the Growth Potential of Non-Interest Gold.
Geopolitical Tensions and Oil Factor:
Despite a temporary 60-day agreement between the U.S. and Iran, tensions around the Strait of Hormuz remain high. Tehran plans to introduce new transit fees for vessels, which Washington rejects. This risk stimulates a capital influx into the safe-haven U.S. dollar. On the other hand, falling oil prices (with CitiBank forecasting a decline in Brent to $60 per barrel by the end of the year amid an increase in OPEC+ production of 188,000 barrels per day starting in August) significantly weaken global inflation risks, reducing the need for aggressive monetary policy tightening by central banks.
Leading Banks' Forecasts Maintain a Bullish Outlook
Brief Technical Analysis
The technical picture for the XAU/USD pair on the daily timeframe indicates consolidation and a temporary loss of directional momentum, while the asset retains long-term bullish positions.
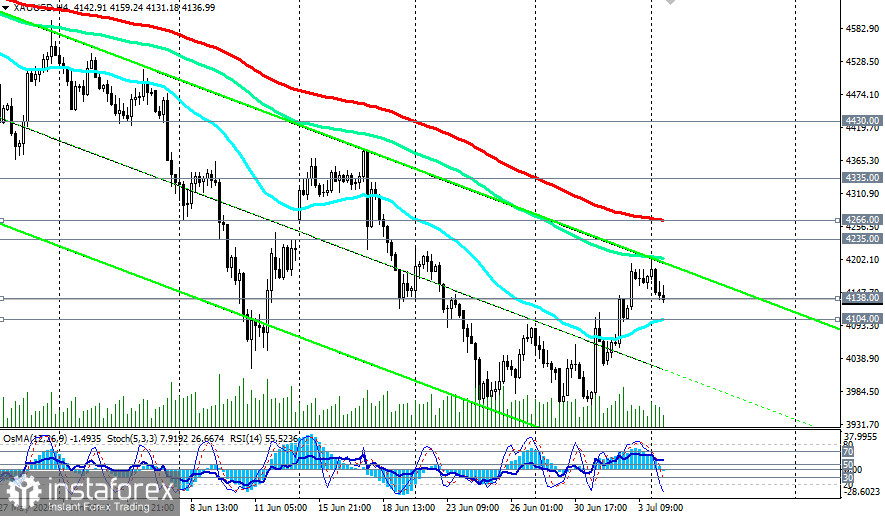
Exponential Moving Averages (EMA 50, 144, 200): XAU/USD quotes remain above key long-term support lines. The 200-week EMA (3125.00) serves as the fundamental basis of the long-term uptrend. A breakout of the 50-, 144-, and 200-day EMAs suggests the current decline is merely a deep correction for now.
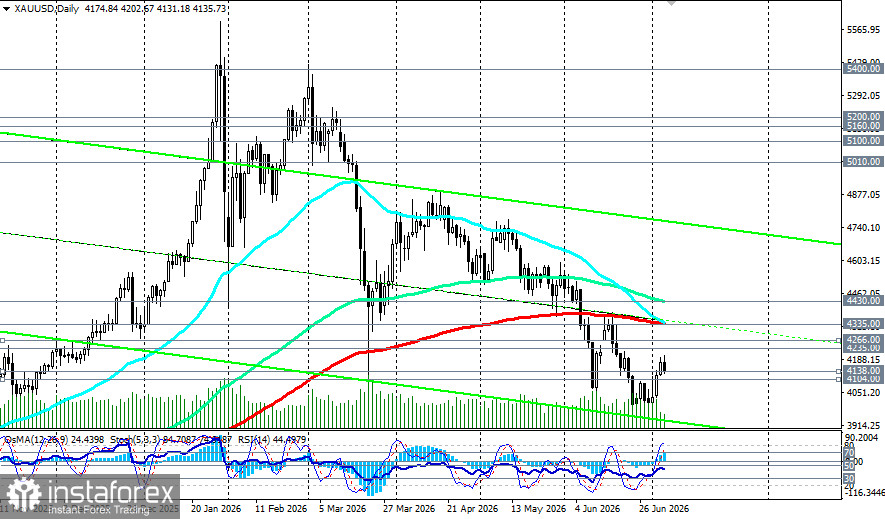
The Relative Strength Index (RSI) on the daily chart is hovering around the 45 mark. The indicator's position below the neutral 50 level suggests a short-term advantage for sellers and a lack of strong directional confidence among bulls at the moment.
The Stochastic Oscillator on shorter timeframes (including H4) shows a withdrawal from the overbought zone and is directed downwards, technically justifying the current intraday pullback from the highs of the Asian session and allowing for further testing of local supports. On the daily chart, the Stochastic has exited the overbought zone and, along with the rising histogram of the OsMA, confirms that attempts at price recovery are still possible, but the market lacks a decisive trigger to form sustainable upward momentum.
In the short term, the direction of XAU/USD will be determined by fresh economic triggers from the U.S. Investors will focus on the ISM Services PMI on Monday, which is forecast to decline from 54.5 to 54.2. If the data comes in worse than expected, it will support the hypothesis of an economic slowdown, strengthen dovish expectations from the Federal Reserve, and apply pressure on the dollar, pushing gold back toward growth. Conversely, strong data and hawkish FOMC minutes (released on Wednesday) could prolong the metal's current correction.
However, considering the geopolitical premium and central bank purchases, the path of least resistance for gold in the medium term lies upward. Gold is currently in a favorable phase of a corrective bounce, supported by easing expectations on Fed rates and sustained structural demand. However, technical indicators suggest potential short-term consolidation. The key zone for determining future trends remains 4100.00–4235.00. Inflation data (CPI) on July 14 and the FOMC meeting on July 29 will be decisive for the next significant move.
Priority for long positions above 4266.00 with targets of 4300.00–4335.00. Short positions should only be considered upon a break below 4100.00.
Consider corrections to the zone of 4100.00–4000.00 as an opportunity to enter long positions. The primary focus remains on structural support factors (central bank demand, geopolitical risks).
Exercise caution due to high volatility. Position sizes should not exceed 2–3% of your trading capital.


