
Vea también


 09.11.2026 07:23 AM
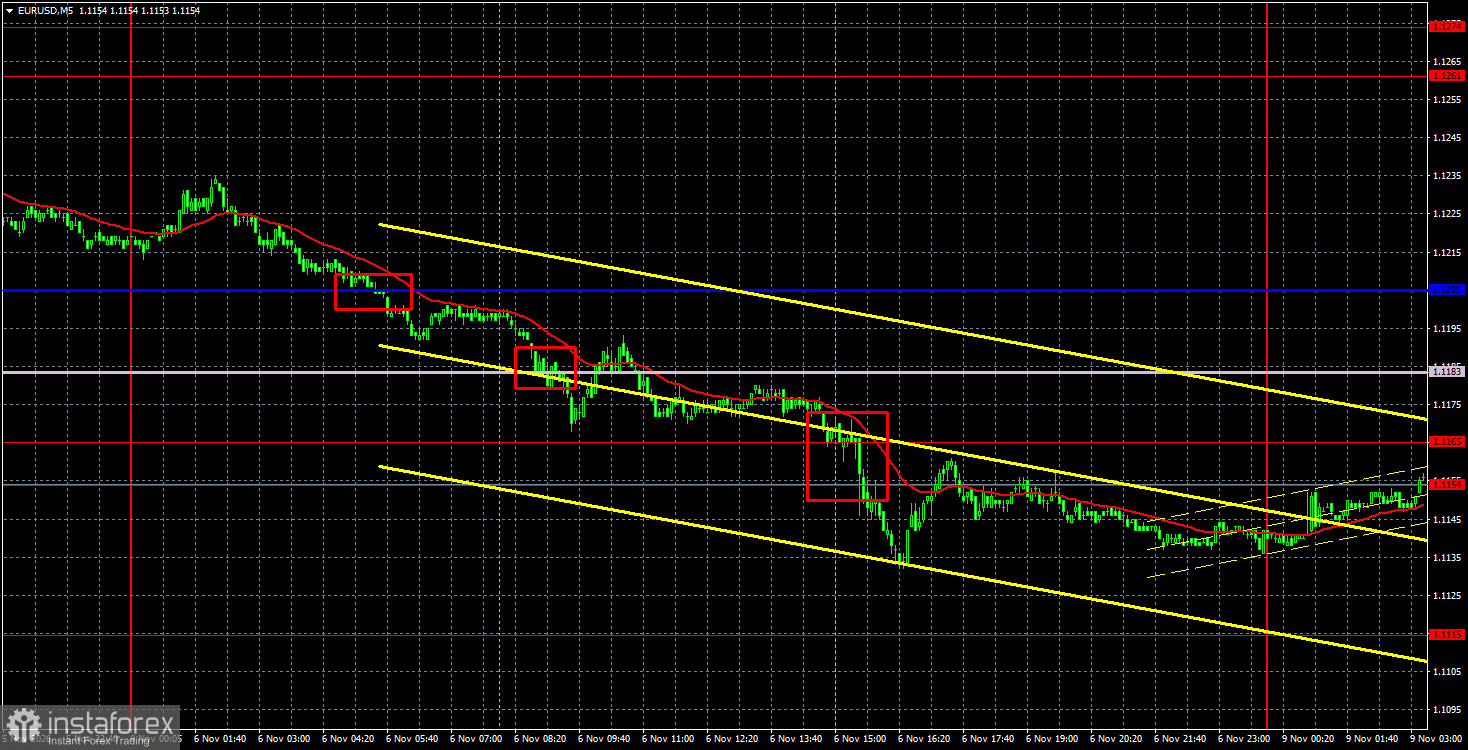
The EUR/USD currency pair continued its downward movement on Friday, following the decline that had already begun on Thursday. The latest decline in the euro began on Thursday after the price failed three times to break above the 1.1261–1.1274 level, which serves as the upper boundary of the monthly sideways channel. Thus, the initial reasons for the euro's decline were technical.
The Nonfarm Payrolls report and the unemployment rate showed strong results. The number of new jobs created outside the agricultural sector reached 165,000 in October, compared with forecasts of 40,000–65,000. The unemployment rate fell to 4.1%, although traders had expected it to remain at 4.2%. However, these reports merely helped the dollar continue strengthening within the sideways channel. Following the release of US economic data, the dollar gained 30 points, which can hardly be considered a strong reaction. By comparison, the price had already fallen 120 points from the upper boundary of the sideways channel.
The US Congressional elections have not created any problems for the dollar so far, despite concerns about a divided government and potential political conflicts between the Democrats and Donald Trump. Overall, EUR/USD remains within a sideways range, and none of last week's events helped the pair break out of this channel.
From a technical perspective, the downward trend may have ended, but the price is still trading within the 1.1115–1.1261 sideways channel. Therefore, the euro's outlook remains uncertain. A rebound from the channel's upper boundary triggered a decline toward its lower boundary. A rebound from the lower boundary could trigger another upward movement toward the upper boundary.
Three sell signals were generated on the 5-minute timeframe on Friday. First, the pair broke below the Kijun-sen line, then the Senkou Span B line, and finally the 1.1154–1.1165 level. Thus, traders could have opened short positions at any of these points, and all such positions would have been profitable.
COT Report
There are still no fundamental factors supporting further strengthening of the US currency. The war in the Middle East temporarily made the dollar particularly attractive, while the Federal Reserve's monetary policy stance provided another boost to the dollar for the second time this year. Over the long term, the euro could decline as far as 1.08 (the trendline), but the upward trend would still remain relevant. However, over the past few months, the market has been taking only positive factors for the dollar into account while ignoring all others.
The positions of the red and blue indicator lines point to bearish dominance. During the latest reporting week, the number of long contracts held by the "Non-commercial" group decreased by 1,300, while the number of short positions increased by 12,600. Consequently, the net position declined by another 13,900 over the week.
EUR/USD Analysis: 1-Hour Chart
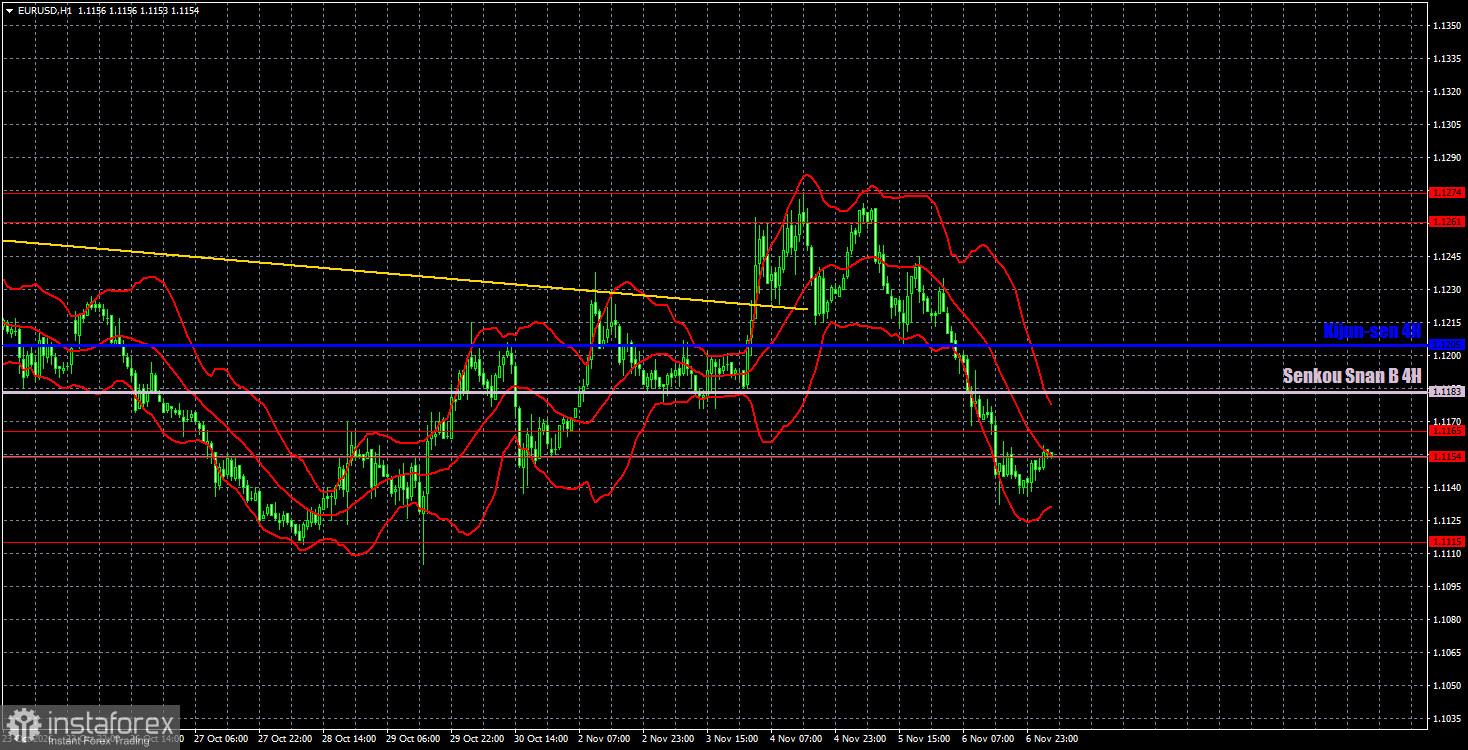
On the hourly timeframe, EUR/USD could potentially establish an upward trend, but it remains within a sideways channel for now. An examination of the daily and weekly timeframes suggests that the chances of a strong and prolonged trend remain high. However, for the euro to appreciate, market participants must be willing to buy it. Over the past two months, there has been little evidence of strong demand for the euro. As long as the price remains within the sideways range, traders can consider trading rebounds from its boundaries.
For November 9, the following trading levels are identified: 1.1006, 1.1115, 1.1154–1.1165, 1.1261–1.1274, 1.1362–1.1368, 1.1461–1.1473, 1.1536–1.1542, 1.1585, and 1.1657–1.1665, as well as the Senkou Span B (1.1183) and Kijun-sen (1.1205) lines. The Ichimoku indicator lines may shift during the day, which should be taken into account when identifying trading signals. Traders should also remember to move the Stop Loss order to breakeven once the price has moved 15 pips in the expected direction. This helps protect against potential losses if the signal proves false.
No important economic events or data releases are scheduled in the European Union or the United States on Monday. Therefore, low volatility and continued sideways trading are highly likely today.
Summary of the Analysis:
Traders may consider short positions with a target near 1.1115, as the price once again failed to break above the 1.1261–1.1274 level, and three sell signals were generated on Friday. If the price rebounds from 1.1115, a target of 1.1261–1.1274 can be considered for long positions.
Explanations for the Illustrations:
Support and resistance levels are shown as thick red lines. Price movements may end near these levels. They are not sources of trading signals.
The Kijun-sen and Senkou Span B lines are Ichimoku indicator lines transferred to the hourly timeframe from the 4-hour chart. They are considered strong technical levels.
Extreme levels are shown as thin red lines from which the price has previously rebounded. They serve as sources of trading signals.
Yellow lines represent trendlines, trend channels, and other technical patterns.
Indicator 1 on the COT charts shows the size of the net position held by each trader category.


